![]()
| Basic Research | https://doi.org/10.21041/ra.v14i1.687 |
Numerical study of RC beams strengthened in shear with CFRP
Estudio numérico de vigas de hormigón armado reforzadas a cortante con PRFC
Estudo numérico de vigas em concreto armado reforçadas ao cisalhamento com PRFC
1 Graduate Program in Civil Engineering, State University of Maringá, Maringá, Brazil.
2 Associate Professor of Civil Engineering Department, State University of Maringá, Maringá, Brazil.
*Contact author: maiconarcine2321@gmail.com
Received: 15/04/2023
Revised: 07/09/2023
Accepted: 13/11/2023
Published: 01/01/2024
| Cite as: Arcine, M. F., Menon, N. V. (2024), "Numerical study of RC beams strengthened in shear with CFRP”, Revista ALCONPAT, 14 (1), pp. 25 - 39, DOI: https://doi.org/10.21041/ra.v14i1.687 |
Abstract
The objective of this study is to numerically investigate the strengthening and adhesive interface of a RC beam under shear forces. The study is based on experimental results from the current literature. The strengthening system consisted of carbon fiber reinforced polymers (CFRP) bonded in a U-shape in the critical shear regions. The numerical simulation results were considered efficient. Small differences in ductility were observed between the simulated and experimental beams, which was attributed to the failure to account for the slip of the reinforcing bars. Even with strengthening, fragile collapses are still observed, resulting from the debonding of a portion of the CFRP.
Keywords: shear; RC beam; strengthening; numerical simulation; debonding.
1. INTRODUCTION
Composite materials have emerged as a reinforcement alternative in cases where the use of traditional materials such as steel sheets and concrete is not suitable. FRPs (Fiber Reinforced Polymers) are composite materials (matrix and reinforcement) consisting of fibers embedded in a polymer matrix. Within the FRP category, the following should be mentioned: Glass fibers (GFRP), aramid fibers (AFRP) and carbon fibers (CFRP). According to Teng et al. (2002), the advantage of these materials over others lies in their corrosion resistance, high strength-to-weight ratio, electromagnetic neutrality and versatility in the strengthening and rehabilitation for reinforced concrete, masonry, steel and timber structures.
However, the debonding of the carbon fiber composite from the substrate of reinforced concrete structures can lead to complete, partial or premature loss of the strengthening effect of the polymer. This failure is characterized by occurring at the ends of the strengthening, where high normal and tangential stresses occur, causing the composite to debond from the concrete, resulting in brittle failure (Baggio, Soudki and Noël, 2014; Colalillo and Sheikh, 2014; Pellegrino and Modena, 2008). FRP debonding can initiate from flexural cracking, flexural/shear cracking, or both, usually near the region of maximum bending moment.
In solving problems such as strengthening debonding, numerical simulations can serve as flexible tools that allow the boundary conditions of the problem to be evaluated and modified. Based on experimental results, the structural behavior of RC beams subjected to shear stresses can be observed (Godat et al., 2007; Manos, Theofanous and Katakalos, 2014; Shomali, Mostofinejad and Esfahani, 2020; Zheng et al., 2020). It is also able to assess the strengthening of these structures and their functionality when debonding failure occurs (Mansour, 2021; Obaidat, Heyden and Dahlblom, 2010; Shomali, Mostofinejad and Esfahani, 2020). Finally, the simulation of new anchoring methods to avoid failure due to debonding can also be investigated numerically (Godat et al., 2007).
Therefore, the aim of this study was to numerically evaluate the strengthening and adhesive interface of a RC beam under shear loading. The system consisted of U-shaped bonded CFRP plates in critical shear regions. The analyzes were performed using ABAQUS 6.12 software based on the experiments conducted by Risson (2016).
2. NUMERICAL MODELS
2.1 Concrete damage plasticity model
Since it is a ceramic material, the behavior of concrete is quasi-brittle, so models that better represent the damage are considered acceptable in simulations of this material (Demin and Fukang, 2017). A multiaxial model called Concrete Damaged Plasticity (CDP), was proposed by Lubliner et al. (1989) and further developed by Lee and Fenves (1998). In this model, also known as the Barcelona model, it is assumed that the damage to the concrete is mainly caused by tensile cracking and compressive crushing.
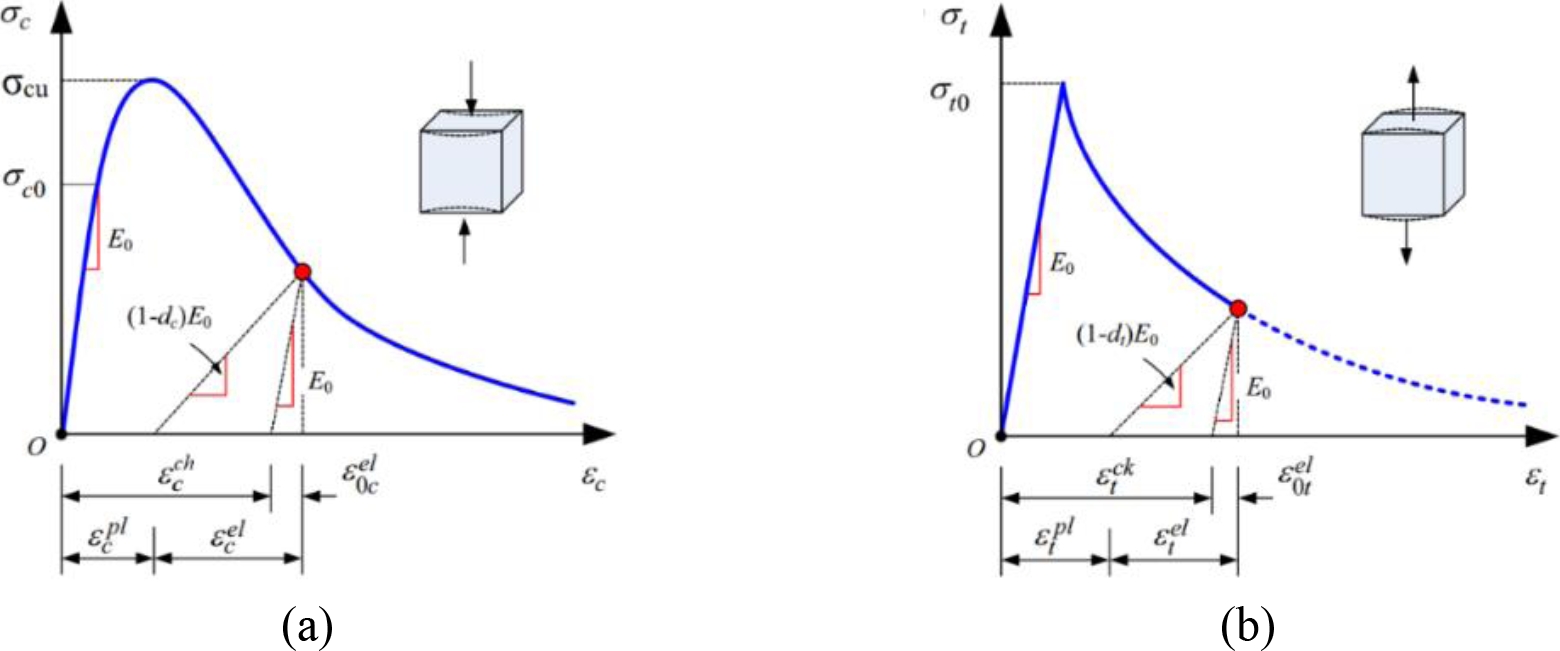
The CDP model offers the possibility of progressive damage modeling in which the scalar damage variable d varies from 0 ≤ d ≤ 1. In this case, d = 0 corresponds to a completely intact material and d = 1 to complete damage or the start of fracture. The damage factors and represent the rate of deterioration of the stiffness of the concrete caused by the damage of the material in compression or tension respectively, under uniaxial tension. Figures 1a and 1b show this behavior.
Figure 1. Concrete stress - strain curves used in CDP for uniaxial compression (a) and tension (b) stress. Adapted from (Chi et al., 2017).
Figure 1a shows that the reaction of the concrete in the stress-strain diagram under uniaxial compressive loading is linear up to the value of the plastic yield stress (). From this tension stress, the plastic regime begins, the stress increases until the final stress (), is reached, which leads to a decrease in the modulus of elasticity. As a result, the stress decreases and the deformation increases. The reaction of the concrete to tension (Figure 1b) results in a linear elastic relationship until the failure stress is reached, at which point microcracks appear in the concrete. At values above this stress, the diagram also shows a decrease in the modulus of elasticity in the curve, which leads to local deformation in the concrete structure, causing the stress to decrease and the deformation to increase.
In general, the deformation can be decomposed into an elastic deformation and a plastic deformation according to the elasto-plastic theory. The other components in figure 1 are crushing strain and cracking strain . The deformations and can be defined as the division of the compressive and tensile stress by the initial modulus of elasticity, respectively. A change in the value of the modulus of elasticity in the plastic range is noted in the diagrams; this value is referred to as the damaged (or effective) modulus of elasticity (), as shown in equation (1).
| (1) |
Equation (2) represents the function of the stress state as a function of the initial elasticity of the strain tensors and the damage in compression () and tension (), where the subscript “i” becomes “c” for compression and “t” for tension:
| (2) |
The CDP model uses the flow function. The use of such a function defines the critical stress state at which plastic deformation begins. The most commonly used yield criteria for materials are those of Mohr-Coulomb and Drucker-Prager and can be written in terms of effective stresses (Chi et al., 2017) as shown in equation (3).
| (3) |
This function uses two stress invariants of the stress tensor, namely the effective hydrostatic stress () and the deviatoric stress (). The constants , and are dimensionless, is the maximum algebraic value of the effective principal stresses and is the Macauley operator defined as . It can be seen that for a plastic deformation of the material sets in while for elastic deformations, there is .
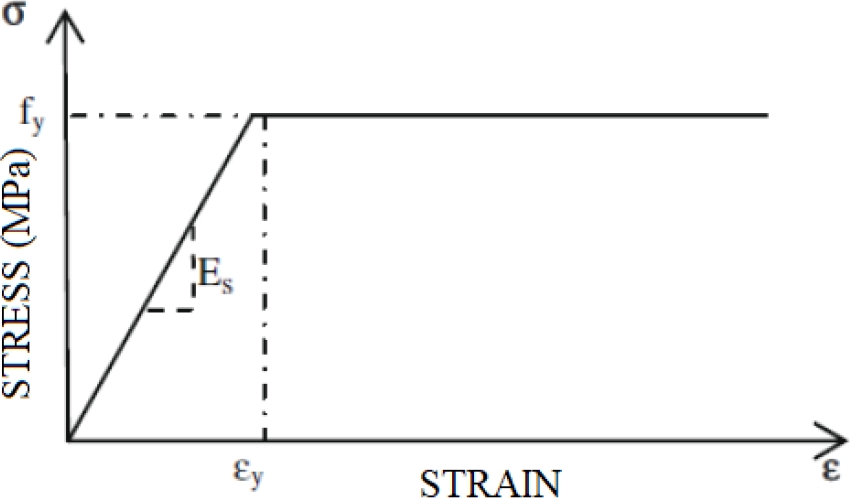
2.2 Constitutive model for steel
In general engineering applications, a perfect elasto-plastic diagram is normally used, which is identical for tension and compression, as shown in figure 3. According to Obaidat, Heyden and Dahlblom (2010), this model provides acceptable results when modeling RC members.
Figure 2. Perfect elasto-plastic behavior for steel. Adapted from (Obaidat, Heyden and Dahlblom, 2010).
Figure 3. Bilinear model for the adhesive interface. Adapted from (Yuan et al., 2004).
2.3 Constitutive model for the CFRP
According to Kezmane, Boukais and Hamizi (2016), FRP composites are anisotropic, which means that their properties are not the same in all directions. The coordinate axes 1, 2 and 3 refer to the principal coordinates of the material, where 1 represents the direction of the fibers (x-axis) and 2 and 3 (y and z, respectively) are perpendicular to 1. It is then referred to as an orthotropic material. In this case, the material properties are the same in directions 2 and 3 (, ), which is called transversely isotropic in ABAQUS. According to the Abaqus User's Guide (2014), under stress conditions applied in the plane of a shell element, only the values of , , , , and are necessary to define such a material. In the software, this behavior is defined by the Lamina function. The shear modules and are included as they may be required to model the transverse shear deformation in the shell element. These data can be determined using the mixing law defined by Piggott (2002). The author reports that the volume of fibers in a fiber-reinforced composite (FRP) can vary between 60% and 70%.
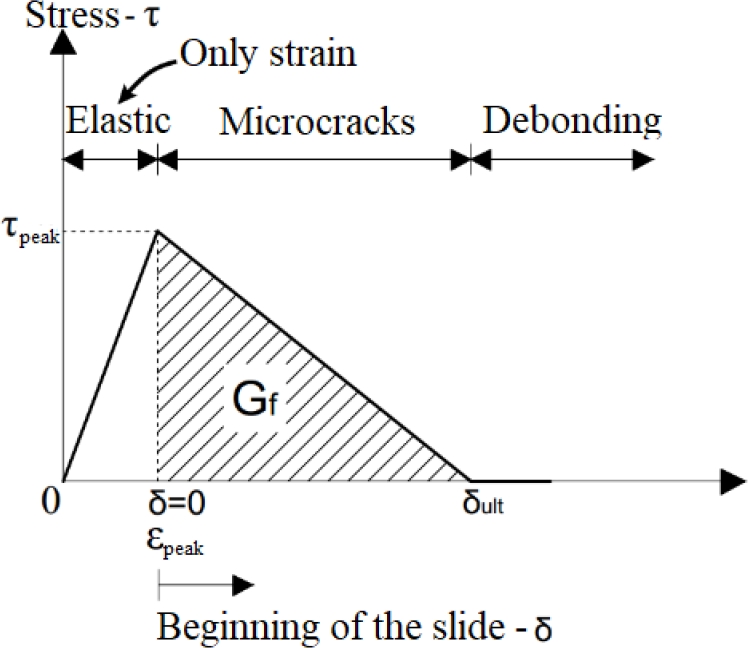
2.4 Constitutive model for the adhesive (cohesive surface)
According to Camanho and Dávila (2002), the simulation of debonding is generally divided into an initial deformation and the propagation of debonding. The shear stress of the joint increases linearly with the deformation of the interface until it reaches the peak stress () and thus the beginning of sliding at the interface. From this point, the damage to the material begins, which is characterized by a decrease in the modulus of elasticity (Figure 3) and is also referred to as interfaces softening (or the appearance of microcracks). When the stress decreases to zero, the value of the maximum slip carried by the system is reached () and from this point on it is no longer possible to transfer stress between the substrates, which is called debonding.
In Figure 3, is the area of the downward region of the model and denotes the fracture energy of the interface.
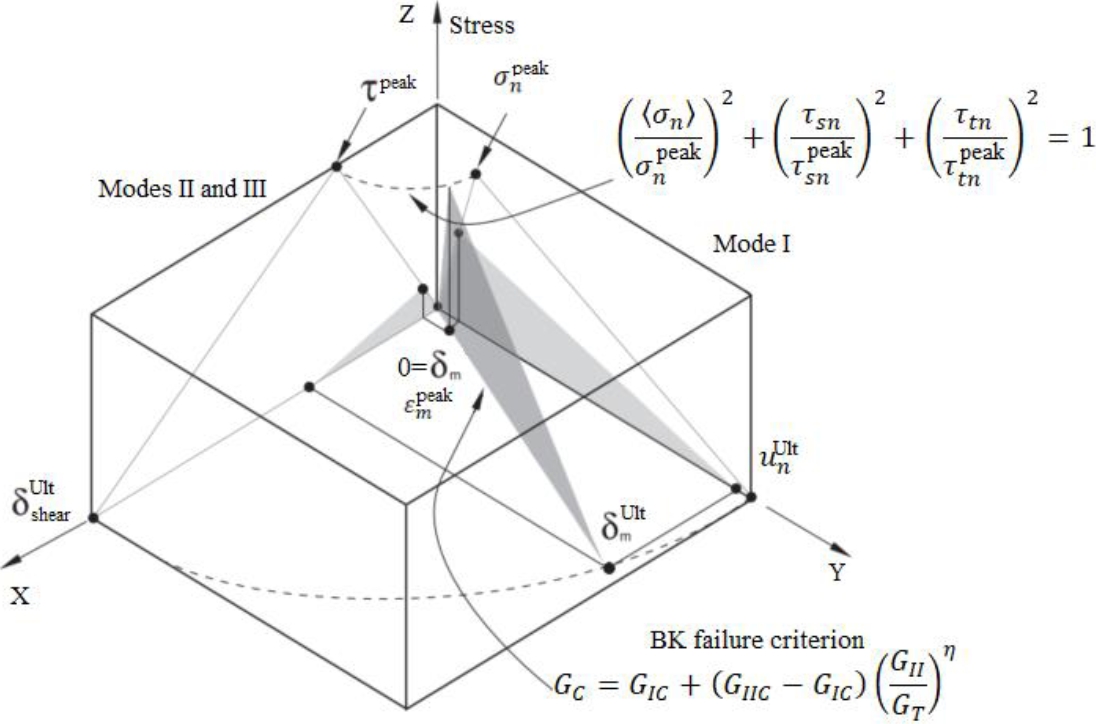
Failure mode II, which is characterized by the sliding of the material on a surface, was shown in figure 3. In shear-strengthened beams, other failure modes can occur in addition to the previously described failure modes, which characterizes the occurrence of the mixed failure mode. This mode represents the constitutive law as a combination of the individual modes (Modes I, II and III). Modes II and III correspond to the previously described model and are represented by the indices and , respectively, which can be seen in figure 4. Mode I is the application of the normal load to the cohesive surface represented by the index . The linear elastic behavior for 3D elements in pure modes I, II or III, with the exception of , can be expressed by equation (4).
| (4) |
Figure 4. Response of cohesive materials in modes I, II, III and mixed. Adopted from Abaqus User´s Guide (2014).
Here, , and are the peak strains. Up to this point, the normal separation (displacement ) and the slip ( e ) are zero. is the stiffness of the adhesive in the normal direction specified by the manufacturer. and can be estimated based on the normal elasticity and Poisson's ratio of the material as . According to Camanho and Dávila (2002), the onset of softening (damage or interfacial sliding) can be predicted by a quadratic failure criterion expressed by equation (5).
| (5) |
To accurately explain the variation in energy derived by failure/collapse in the mixed mode, Benzeggagh and Kenane (1996) established a criterion called the BK fracture criterion. This criterion can be expressed by equation (6).
| (6) |
Where is the material parameter and can be obtained from experimental MMB experimental tests (Camanho & Dávila, 2002). The terms and are the interfacial fracture energies in modes I and II, is the sum of these two energies and is the energy release rate in mode II. Figure 4 shows in general the mixed-mode behavior of cohesive materials.
One way to obtain stress values is to use equations (7)-(9) from the work of Lu et al. (2005), Chen et al. (2010) and Colalillo and Sheikh (2014).
| (7) |
| (8) |
| (9) |
Where is the coefficient of the ratio between spacingand width relationship, is the width of the bond (mm), is the spacing of the FRP strengthening between the slabs (mm) (for pull-out tests, the spacing is equal to the width of the bond) and is the concrete tensile strength (MPa).
3. MATERIALS AND METHODS
3.1 Materials and Specimens
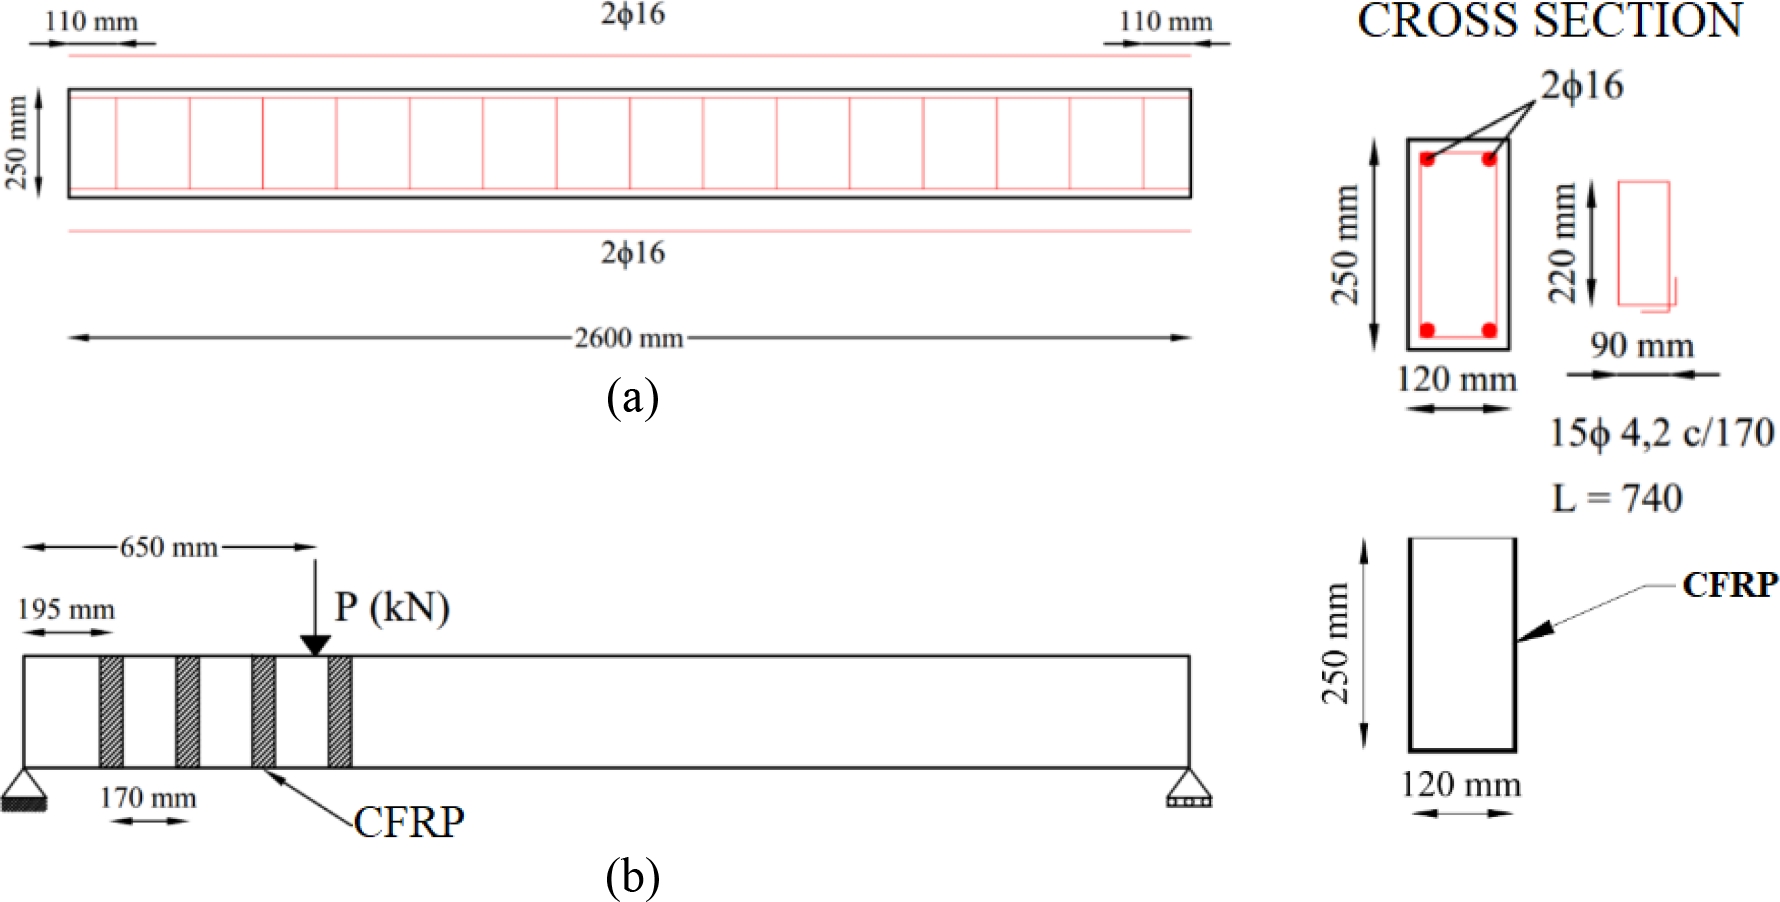
The experiment used in the simulations was tested by Risson (2016), who carried out a series of experimental tests on shear-strengthened RC beams with CFRP. The cylindrical compressive strength of the concrete after 28 days () is 37.6 MPa. To estimate the value of the tensile strength of the material, the equation of Genikomsou and Polak (2015) () was used and 1.98 MPa was obtained. The modulus of elasticity of the concrete was determined in accordance with the American standard (ACI 318, 2014) and was found to be 28.8 GPa. The Poisson's ratio to be used for the concrete is 0.2. As part of the investigation, an unstrengthen reference beam (VCR) was tested and then strengthened it, with CFRP oriented at 90° to its axis (VC0-90). It is worth noting that the reinforcements were designed so that the failure was due to the yielding of the stirrups and not the bending. Therefore, the transverse reinforcement was undersized, while the longitudinal reinforcement was oversized, which did not comply with the legal recommendations. Figure 5 shows the situations described together with the boundary conditions in detail.
Figure 5. Beam VCR (a) and VC0-90 (b). Adopted from (Risson, 2016).
The steel used experimentally for the stirrups was CA-60 with an average yield strength of 618.63 MPa. The longitudinal bars belonged to the CA-50 category and had an average yield strength of 581.37 MPa. The Poisson's ratio to be adopted was 0.3 and the modulus of elasticity was 190 GPa. The strengthening material used was SikaWrap300 C, a CFRP (carbon fiber reinforced polymer) sheet. This product is 0.167 mm thick and 50 mm wide and has a modulus of elasticity of 230 GPa. The material used to bond the sheet to the concrete substrate was Sikadur330.
3.2 Numerical modeling
The software used for the simulations was ABAQUS 6.12. In the absence of experimental stress-strain curves in compression and tension, these were determined numerically according to Guo (2014). The damage-deformation was estimated using equations (1) and (2).
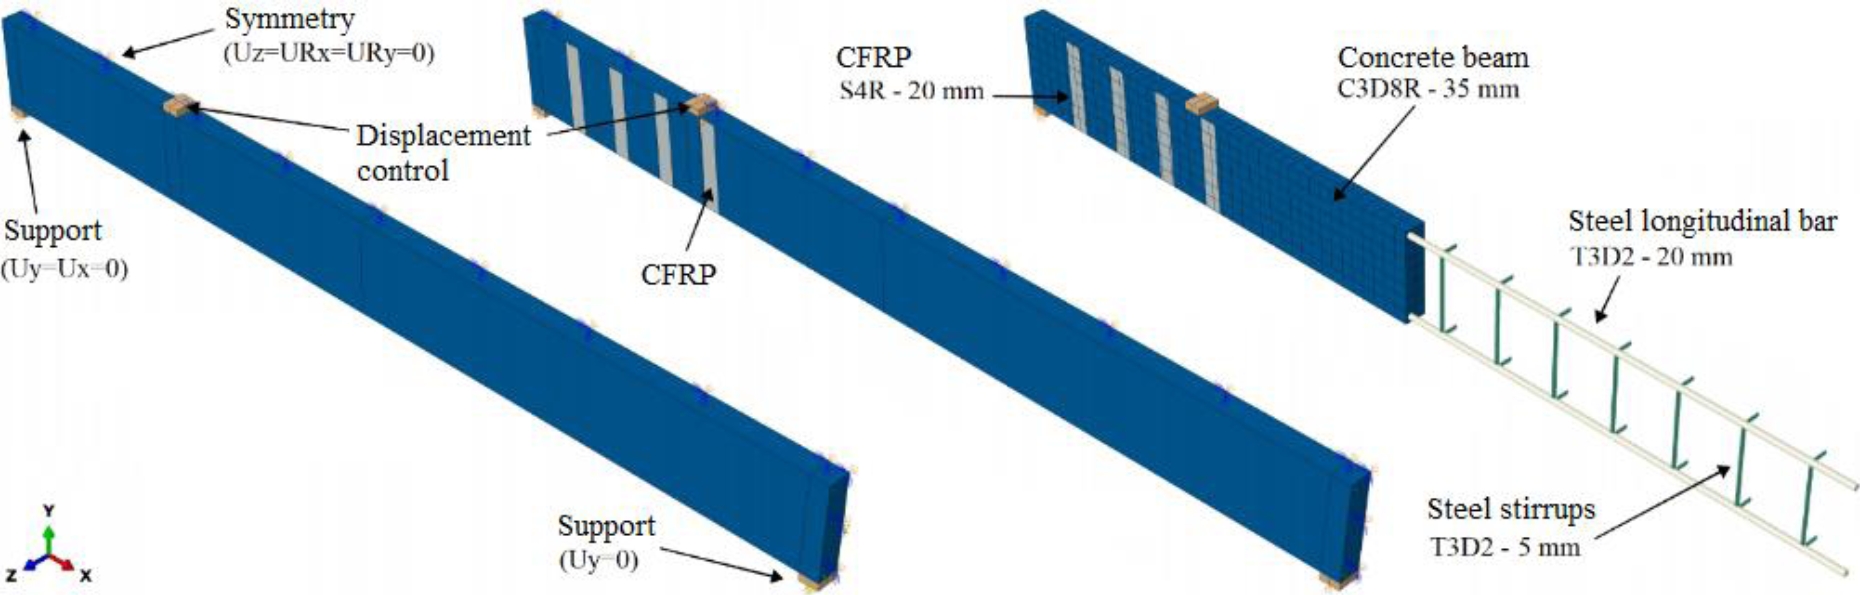
A three-dimensional geometric model consisting of solid elements was chosen to model the concrete beam. The element type used for the concrete is C3D8R (quadrilateral solid element with 8 nodes with reduced integration) with a mesh size of 35 mm (1036 elements). The numerical model used was the CDP. The three-dimensional bar element available in the software is defined as a wire and was used to represent the steel reinforcement. These are of the truss type, called T3D2 (2 nodes). The mesh size for the longitudinal reinforcement was 20 mm (260 elements) and 5 mm for the stirrups (930 elements). The embedded region function was used as the method for the interaction between steel and concrete. The external strengthening was modeled as a thin shell element. The type used was S4R (square with 4 nodes of reduced integration) and a 20 mm mesh (156 elements). The chemical adhesive interface was simulated as a cohesive surface. The load was applied in the form of a displacement. Since it has symmetry in a plane, this property was applied to the beam during modeling. Newton - Raphson was used as the simulation strategy. These properties are shown in figure 6.
Figure 6. Boundary conditions and element type used for simulations.
For the strengthening material, the properties to be entered into the software were calculated according to Piggott (2002) (Table 1). The concentration of the composite materials was assumed to be 70% fibers and 30% polymer matrix due to a lack of information from the manufacturer. Quadratic traction was used as the criterion for the onset of debonding and Benzeggagh and Kenane (BK) for failure in mixed mode. The value of the calculated peak shear stress () was 5.32 MPa. However, according to Obaidat, Dahlblom and Heiden (2010), this value is too high to predict the debonding of the material and they therefore recommend reducing it to 1.50 MPa. Also, according to Obaidat, Dahlblom and Heiden (2010), the best values for fracture energy according to numerical simulations are . The energy value in mode I is the area under the softening curve (Figure 3) and gives approximately .
Table 1. Data for the simulation of CFRP and cohesive surface (adhesive).
| CFRP sheet (SikaWrap® 300 C) | |||||
| Elastic modulus (GPa) | Transverse elastic modulus (GPa) | Poisson’s ratio | |||
| E11 | E22 = E33 | G12 = G13 | G23 | ν12 = ν 13 | ν 23 |
| 230,00 | 16,56 | 6,16 | 5,85 | 0,24 | 0,42 |
| Adhesive (Sikadur®330) | |||||
| Stiffness (MPa) | Stress (MPa) | Fracture energy (mJ/mm²) | |||
| Knn | Kss = Ktt | GIC | GIIC = GIIIC | ||
| 45001* | 1730,82* | 3,15 | 1,50 | 0,09 | 0,9 |
1*Provided by the manufacturer Sika®
4. RESULTS AND DISCUSSIONS
The computer used for the analyzes has 8 GB of RAM, a Core (TM) i5-7300HQ 2.50 GHz CPU with 4 cores and a GeForce GTX 1050 graphics card.
4.1 Reference beam without strengthened (VCR)
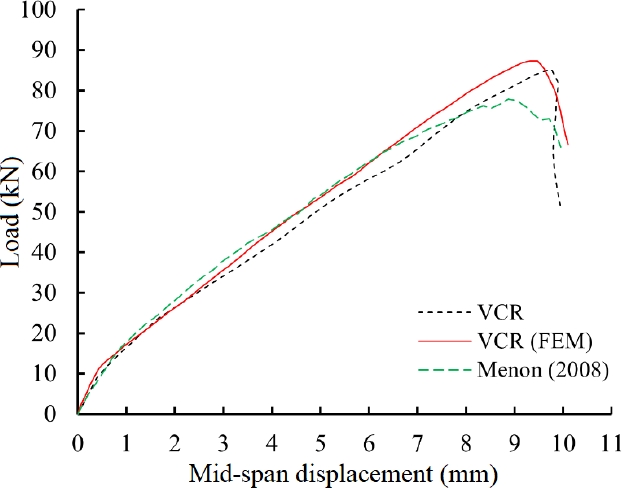
The underlying CDP parameters used in this study to calibrate the VCR beam are listed in Table 2, where is the expansion angle, m is the eccentricity, is the ratio between the yield stresses in the equibiaxial test and the uniaxial test, is the ratio between the distance from the hydrostatic axis to the tension and compression meridian in the deviatoric plane, and is the viscosity. The experimental and numerical load-displacement curves at the middle of the span are shown in figure 7. To prove the efficiency of the model, an experimental study conducted by Menon (2008) was added. Although the study by Menon (2008) is not identical, it has similar properties to the bar of Risson (2016), which justifies its analysis.
Table 2. CDP parameters according to current literature and used in this work.
| Reference | (MPa) | Structural element | m | ||||
| Al-Osta et al. (2017) | 54 | Beam | 36° | 0,1 | 1,16 | 0,667 | 0 |
| Arcine (2020) | 31,2 | Beam | 38° | 0,1 | 1,16 | 0,667 | 10-4 |
| Demin and Fukang (2017) | 26,8* | Beam | 30° | 0,1 | 1,16 | 0,667 | 10-4 |
| Genikomsou and Polak (2015) | 33 – 46 | Slab/Column | 40° | 0,1 | 1,16 | 0,667 | 10-5 |
| Jumaa and Yousif (2019) | 43,2 – 73,4 | Beam | 30° | 0,1 | 1,16 | 0,667 | 0 |
| This work | 37,6 | Beam | 38° | 0,1 | 1,16 | 0,667 | 5.10-4 |
*Characteristic compressive strength of the concrete.
Figure 7. Load-displacement curve at the middle of the span of the VCR beam.
With an experimentally determined ultimate load of 85.31 kN and 87.25 kN numerically determined by Risson (2016), the relative error was 2.27 %, which is considered satisfactory. The load-displacement curve of the VCR beam (FEM) showed a similar stiffness to the experimental beam of Menon (2008). The deviation in the peak load is due to the difference between the compressive strength of the concrete, as in the work of Risson (2016) this resistance is 37.6 MPa, while in the work of Menon (2008) it is 31.2 MPa. The graphical results show that the three curves have a similar initial stiffness but a slightly different final stiffness. According to Obaidat, Heyden and Dahlblom (2010), one explanation for this situation could be the perfect bond between concrete and steel with the embedded region function. According to Dehestani and Mousavi (2015), the relative displacement between a steel bar and concrete is controlled by the behavior of the connection between these materials. This relationship can lead to reinforced concrete beams being more or less ductile. In general, numerical simulations assume a perfect connection between steel and concrete (embedded region), which makes a reinforced concrete beam stiffer. Therefore, considering factors that simulate reinforcement sliding in numerical simulation models can contribute to greater accuracy of results (Arcine, 2020; Arcine, Menon, Krahl, 2023). Jumaa and Yousif (2019) state that microcracks caused by the shrinkage of concrete also reduce the stiffness of test beams, and in numerical modeling, the materials are considered homogeneous and this factor is not considered. Therefore, it can be said that the modeling reproduces the experimental results coherently.
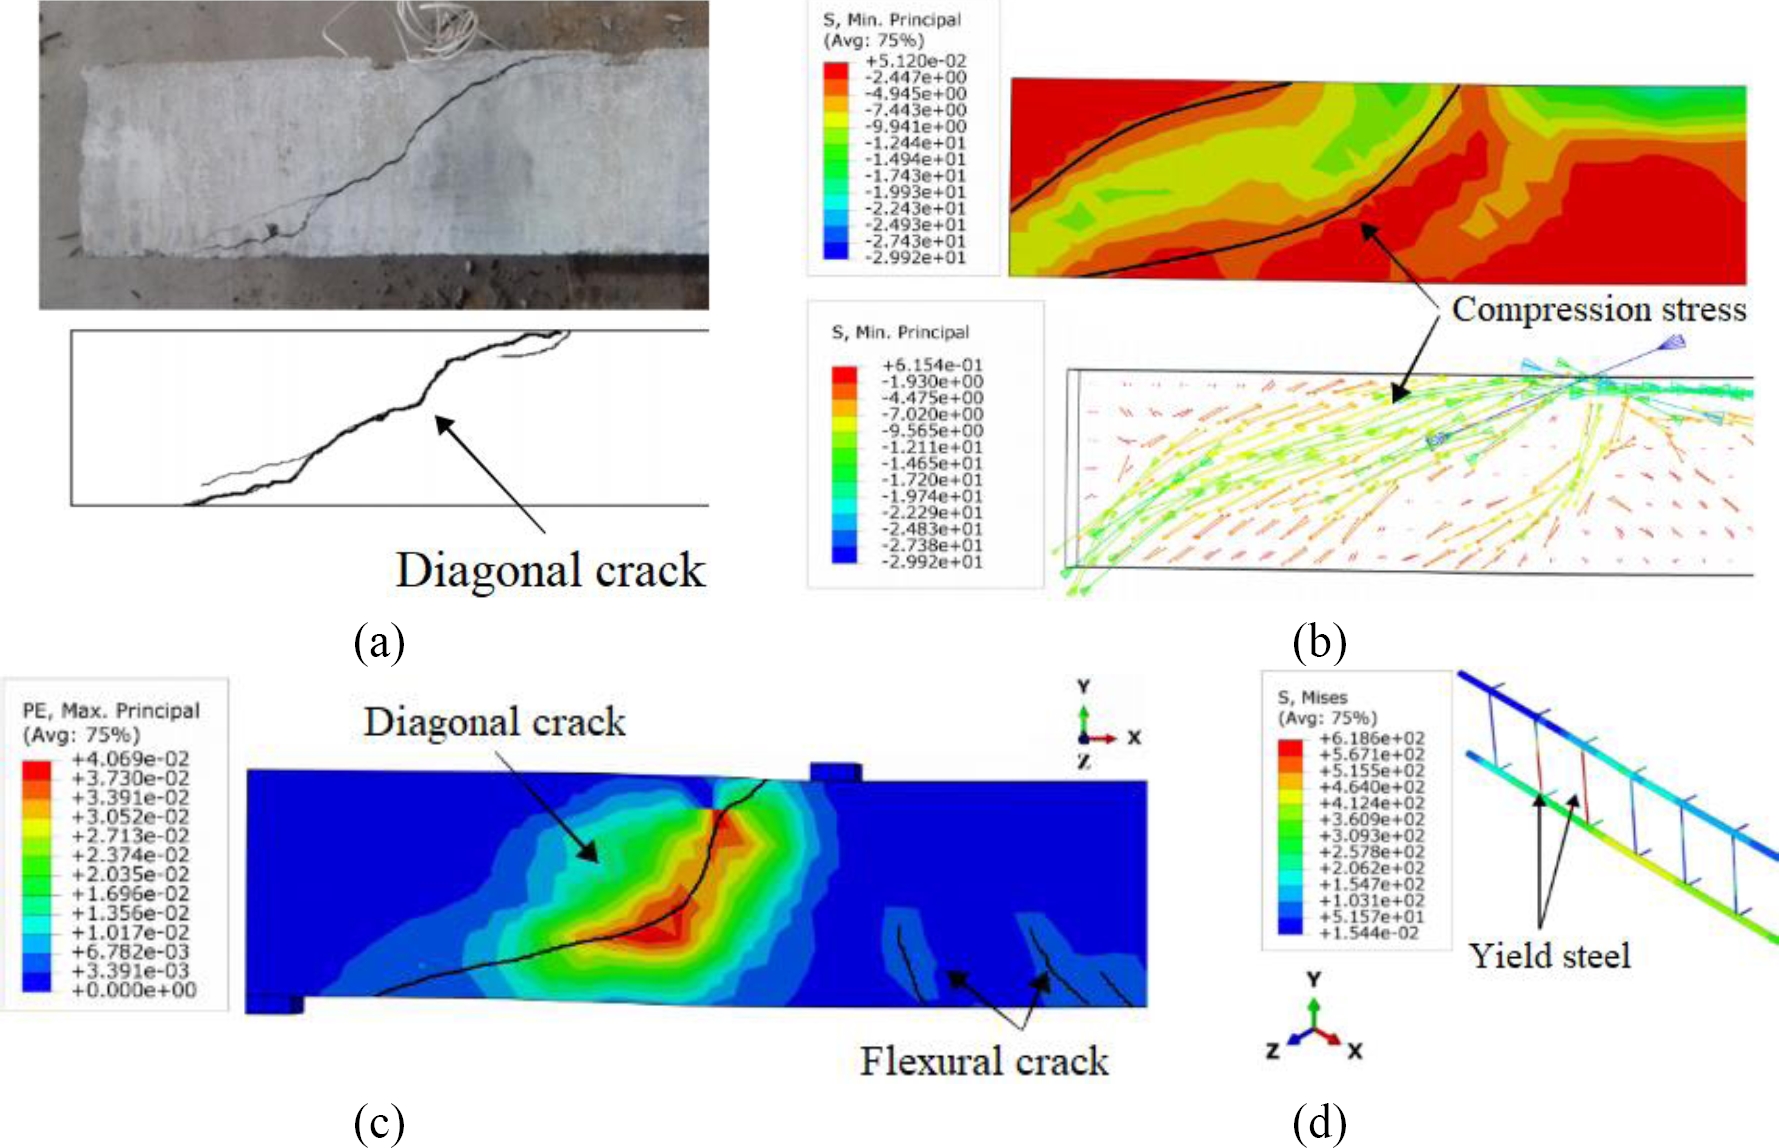
The reference beam failed after the development of the diagonal crack between the point of load application and the support. Figure 8b shows the formation of the compression diagonal in the shear span. The experimental critical crack was also seen in the numerical results, as shown in figure 8c, accompanied by some flexural cracks. Similar results were observed in other studies (Al-Osta et al, 2017; Demin and Fukang, 2017; Jumaa and Yousif, 2019; Arcine, Menon, and Krahl, 2023). Experimentally, beam failure occurred when the resistance capacity of the transverse reinforcement was exhausted. This phenomenon was also observed in the numerical simulation by Arcine (2020), in which the 618 MPa given to the software as yield stress was detected in the stirrups (Figure 8d).
Figure 8. Experimental crack pattern (a), stress concentration (b), numerical crack pattern (c) and Von Mises stresses of the frame (d) of the VCR beam (units in MPa).
4.1 Strengthened beam (VC0-90)
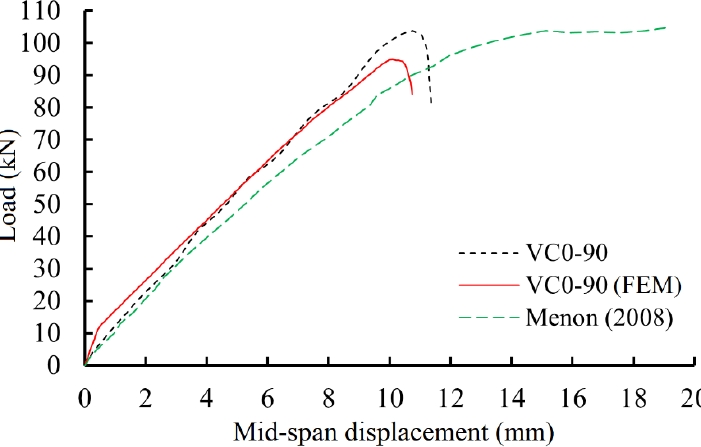
Figure 9 shows the numerical and experimental results of the beam strengthened with CFRP (VC0-90) in shear as well as the experimental results of Menon (2008). There is good agreement between the results. The numerical test VC0-90 (MEF) and the experimental VC0-90 showed unloading in the post-peak region, which characterizes the failure of the cohesive surface, or in the experimental case, the debonding of the strengthening and subsequent collapse in shear. It was found that the shear strengthening of these beams significantly increased their ductility with an increase in resistance of approximately 18%. As for the peak load, the experimental VC0-90 beam reached a load of 102.5 kN, while the simulated VC0-90 (FEM) reached 94.9 kN, which corresponds to a relative error of 7.41%. This behavior shows that the simulated beam exhibited premature debonding before the experimental beam. This can be attributed to the data assumed according to Obaidat, Dahlblom and Heiden (2010), because to obtain more accurate results, experimental tests are required that better describe the material used experimentally. Nevertheless, there were only minor deviations in behavior and the result was considered satisfactory.
Figure 9. Load-displacement curves at mid-span for the strengthened beam (VC0-90).
Figure 9 shows a good agreement between the numerical behavior of the Risson beam (2016) and the experimental behavior tested by Menon (2008). However, this experimental behavior showed a large ductility after the peak, without a softening section. In this case, in addition to the compressive strength of the concrete, there is another difference in the position of the carbon sheet, since in the experimental tests carried out by Menon (2008), the CFRP was positioned between the stirrups and did not debond from the interface as described in the literature (Arcine, Menon and Krahl, 2023; Pellegrino and Modena, 2008). The lack of softening after the peak could be determined numerically if the interface was considered perfect, i.e., it would not be possible to observe debonding, as was also the case with the results of Obaidat, Dahlblom and Heiden (2010).
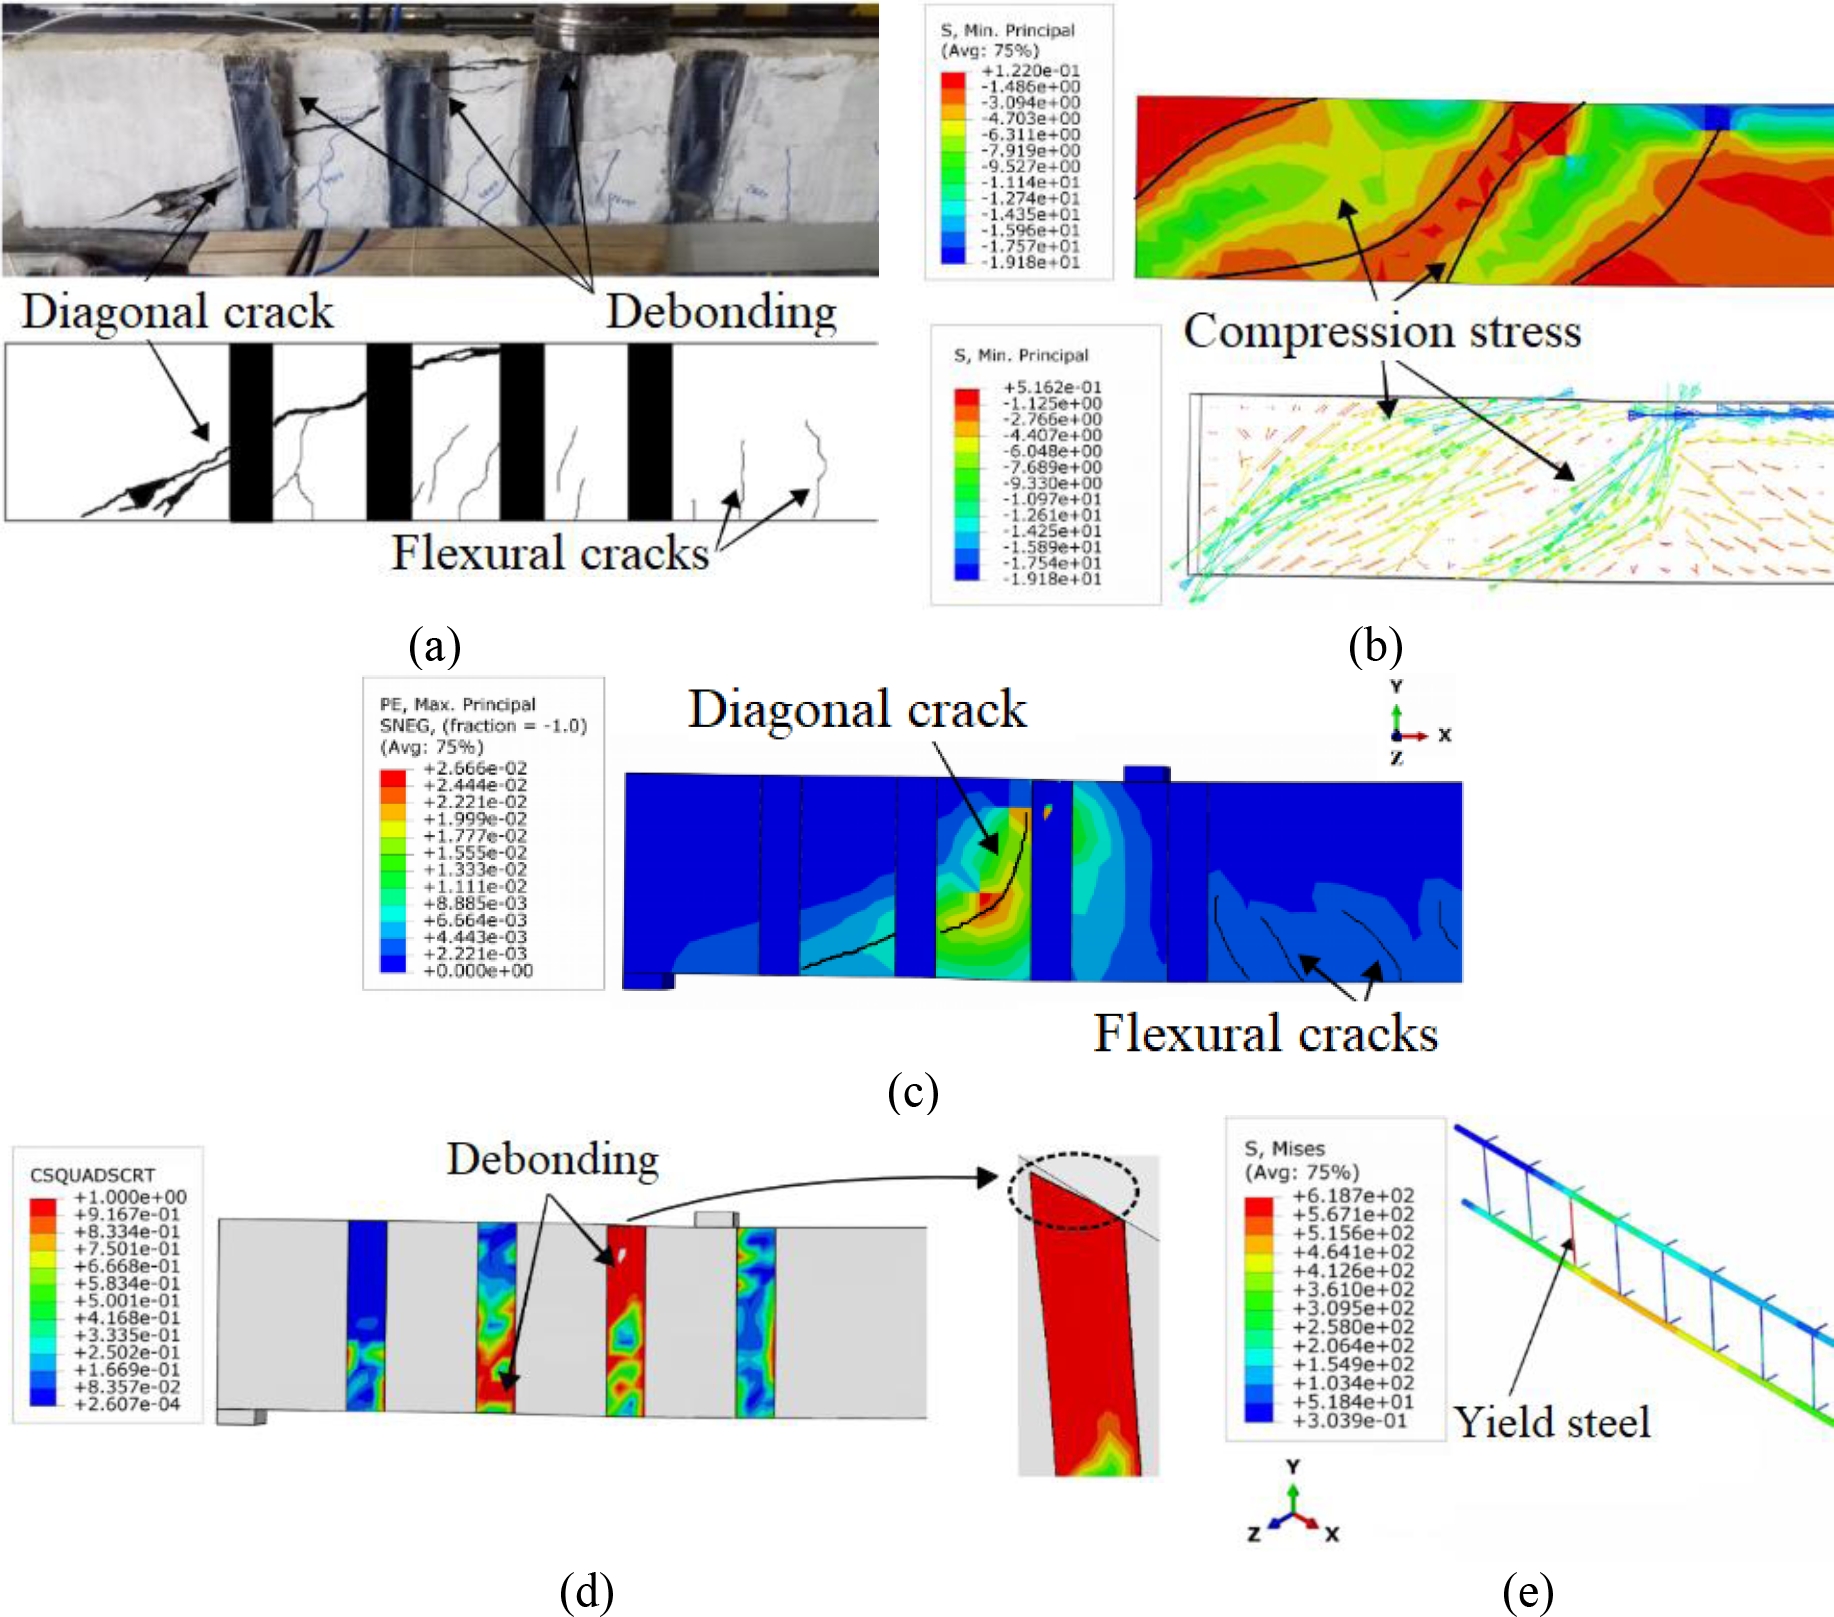
Figure 10 shows the failure modes of the shear-strengthened beams and the critical areas of cracking and stresses in the steel. The formation of two compression diagonals was observed in the VC0-90 beam, unlike the VCR beam where only one compression diagonal formed (Figure 8b). Figure 10d shows areas of debonding that are very similar to the experimental results and areas of cracking where the debonding is represented by the color red (damage equal to 1.0) (Obaidat, Heyden and Dahlblom, 2010). According to Arcine, Menon and Krahl (2023) and Pellegrino and Modena (2008), the position of the strengthening before the stirrups can influence the resistance of the strengthened beam. This is because the CFRP, when positioned between the inner stirrups, provides confinement and thus increases the resistance of the beam, which is not the case when positioned above the stirrups.
Figure 10. Experimental crack pattern (a), stress concentration (b), numerical crack pattern (c), debonding regions (d) and Von Mises stresses of the frame (e) of the VC0-90 beam (units in MPa).
Figure 10e shows the stresses in the reinforcement after the end of the simulation. As before, yielding of the transverse reinforcement occurred, but this time this phenomenon was only observed in one of the four stirrups in the shear span. This fact shows that even with CFRP strengthening, the concrete and such reinforcement still suffer from shear stresses due to premature debonding of the composites (Arcine, Menon and Krahl, 2023; Pellegrino and Modena, 2008). Furthermore, the bottom longitudinal bar (near the yielding stirrup) reached an approximate stress of 464.1 MPa, indicating the need for a more efficient anchoring system to ensure better material utilization. Pellegrino and Modena (2008) pointed out that one of the factors affecting the strengthening efficiency is the presence of steel stirrups.
5. CONCLUSIONS
The aim of this work was to identify the most important parameters controlling the structural behavior of rectangular reinforced concrete beams externally strengthened in shear with CFRP. This required numerical modeling using ABAQUS 6.12 software. The modeling results were compared with experimental tests by Risson (2016). The problem seems to be very comprehensive as it addresses several topics such as damage mechanics, constitutive models, plasticity theory, shear strengthening and different modeling. The main conclusions are summarized below:
The study proved to be suitable for predicting the behavior of reinforced and shear-strengthened beams. The modeling of the cohesive surface accurately predicted the damage process in the adhesive, in contrast to situations where perfect bonding is assumed. Reading the stresses in the steel showed that strengthening the beams delays the onset of yielding of the steel, which can also reduce the deformation of the concrete. The use of externally bonded CFRP material as a shear-strengthening element can greatly increase the load-bearing capacity of reinforced beams. However, fragile collapses can still be observed without much knowledge from professionals. The use of more efficient shear strengthening systems, such as the use of mechanical anchors, can increase shear strength and cause flexural failure. To improve the effectiveness of strengthening, the possibilities of debonding of CFRP and the measures to mitigate it should be studied in detail.
6. ACKNOWLEDGMENTS
O presente trabalho foi realizado com apoio da Coordenação de Aperfeiçoamento de Pessoal de Nível Superior - Brasil (CAPES) - Código de Finaciamento 001.
7. REFERENCES
"ABAQUS 6.12: Analysis User’s Guide” (2012). Vol. 1, 2, 3, 4 e 5. Dassault Systèmes Simulia Corp, Providence, RI, USA.
Al-Osta, M. A. et al (2017), Flexural behavior of reinforced concrete beams strengthened with ultra-high performance fiber reinforced concrete. Construction and Building Materials, v. 134, p. 279-296. http://dx.doi.org/10.1016/j.conbuildmat.2016.12.094
Arcine, M. F. (2020), "Simulação numérica para vigas retangulares em concreto armado reforçadas ao cisalhamento com composito de Fibra de Carbono", Dissertação de Mestrado em Engenharia de Estruturas, Universidade Estadual de Maringá, Maringá.
Arcine, M. F., Menon, N. V., Krahl, P. A. (2023), Numerical and experimental study of the interaction between stirrups and shear strengthening with CFRP in RC beams. Engineering Structures, v. 278. https://doi.org/10.1016/j.engstruct.2022.115514
Baggio, D., Soudki, K., Noël, M. (2014), Strengthening of shear critical RC beams with various FRP systems. Construction and Building Materials, v. 66, p. 634-644. https://doi.org/10.1016/j.conbuildmat.2014.05.097
Benzeggagh, M. L., Kenane, M. (1996), Measurement of mixed-mode delamination fracture toughness of unidirectional glass/epoxy composites with mixed-mode bending apparatus. Composites Science and Technology, v. 56, p. 439-449. https://doi.org/10.1016/0266-3538(96)00005-X
Camanho, P. P., Dávila, C. G. (2002), Mixed-Mode decohesion finite elements for the simulation of delamination in composite materials. Nasa/Tm-2002-211737, p. 42.
Chen, G. M. et al (2010), Interaction between Steel Stirrups and Shear-Strengthening FRP Strips in RC Beams. Journal of Composites for Construction, v. 14, n. 5, p. 498-509, 2010.
Chi, Y. et al (2017), Finite element modeling of steel-polypropylene hybrid fiber reinforced concrete using modified concrete damaged plasticity. Engineering Structures, v. 148, p. 23-35. https://doi.org/10.1061/(ASCE)CC.1943-5614.0000120
Colalillo, M. A., Sheikh, S. A. (2014), Behavior of shear-critical reinforced concrete beams strengthened with fiber-reinforced polymer-Experimentation. ACI Structural Journal, v. 111, n. 6, p. 1373-1384. 10.14359/51687035
Demin, W., Fukang, H. (2017), Investigation for plastic damage constitutive models of the concrete material. Procedia Engineering, v. 210, p. 71-78, 2017. https://doi.org/10.1016/j.proeng.2017.11.050
Genikomsou, A. S., Polak, M. A. (2015), Finite element analysis of punching shear of concrete slabs using damaged plasticity model in ABAQUS. Engineering Structures, v. 98, p. 38-48. https://doi.org/10.1016/j.engstruct.2015.04.016
Godat, A. et al (2007), Numerical Modeling of FRP Shear-Strengthened Reinforced Concrete Beams. Journal of Composites for Construction, v. 11, p. 640-649. https://doi.org/10.1061/(ASCE)1090-0268(2007)11:6(640)
Godat, A., Labossière, P., Neale, K. W. (2012), Numerical investigation of the parameters influencing the behaviour of FRP shear-strengthened beams. Construction and Building Materials, v. 32, p. 90-98. 10.1016/j.conbuildmat.2010.11.110
Guo, Z. (2014), "Principles of reinforced concrete design". Butterworth-Heinemann, Pequim, China, p. 587.
Jumaa, G. B., Yousif, A. R. (2019), Numerical modeling of size effect in shear strength of FRP-reinforced concrete beams. Structures, v. 20, p. 237-254. https://doi.org/10.1016/j.istruc.2019.04.008
Kezmane, A., Boukais, S., Hamizi, M. (2016), Numerical simulation of squat reinforced concrete wall strengthened by FRP composite material. Frontiers of Structural and Civil Engineering, v. 10, n. 4, p. 445-455. https://doi.org/10.1007/s11709-016-0339-9
Lee, J., Fenves, G. L. (1998), Plastic-damage model for cyclic loading of concrete structures. Journal of Engineering Mechanics, v. 124, n. 8, p. 892-900. https://doi.org/10.1061/(ASCE)0733-9399(1998)124:8(892)
Lu, X. Z. et al (2005), Bond-slip models for FRP sheets/plates bonded to concrete. Engineering Structures, v. 27, n. 6, p. 920-937, 2005. https://doi.org/10.1016/j.engstruct.2005.01.014
Lubliner, J. et al (1989), A plastic-damage model for concrete. International Journal of Solids and Structures, v. 25, n. 3, p. 299-326. https://doi.org/10.1016/j.engstruct.2005.01.014
Manos, G. C., Theofanous, M., Katakalos, K. (2014), Numerical simulation of the shear behaviour of reinforced concrete rectangular beam specimens with or without FRP-strip shear reinforcement. Advances in Engineering Software, v. 67, p. 47-56. http://dx.doi.org/10.1016/j.advengsoft.2013.08.001
Mansour, W. (2021), Numerical analysis of the shear behavior of FRP-strengthened continuous RC beams having web openings. Engineering Structures, v. 227, p. 111451. https://doi.org/10.1016/j.engstruct.2020
Obaidat, Y. T., Heyden, S., Dahlblom, O. (2010), The effect of CFRP and CFRP/concrete interface models when modelling retrofitted RC beams with FEM. Composite Structures, v. 92, n. 6, p. 1391-1398. https://doi.org/10.1016/j.compstruct.2009.11.008
Pellegrino, C., Modena, C. (2008), An experimentally based an a lytical model for the shear capacity of FRP-strengthened reinforced concrete beams. Mechanics of Composite Materials, v. 44, n. 3, p. 231-245. https://doi.org/10.1007/s11029-008-9016-y
Piggott, M. (2002), "Load bearing fibre composites ". 2 ed. Kluwer Academic Publishers, Ontario, Canadá, p. 490.
Risson, A. V. (2016), "Estudo experimental de sistema de ancoragem por cordão de fibra de carbono para vigas reforçadas com PRFC", Master Thesis, Universidade Estadual de Maringá, p. 160.
Shomali, A., Mostofinejad, D., Esfahani, M. R. (2020), Experimental and numerical investigation of shear performance of RC beams strengthened with FRP using grooving method. Journal of Building Engineering, v. 31, p. 101409. https://doi.org/10.1016/j.jobe.2020.101409
Teng, J. et al (2002), "FRP-strengthened RC Structures". 1st ed. Wiley, Chichester, U.K, p. 272.
Yuan, H. et al (2004), Full-range behavior of FRP-to-concrete bonded joints. Engineering Structures, v. 26, n. 5, p. 553-565, 2004. https://doi.org/10.1016/j.engstruct.2003.11.006
Zheng, Y. Z. et al (2020), Experimental investigation and numerical analysis of RC beams shear strengthened with FRP/ECC composite layer. Composite Structures, v. 246, p. 112436. https://doi.org/10.1016/j.compstruct.2020.112436