![]()
| Basic Research | https://doi.org/10.21041/ra.v15i1.703 |
Influence of the mortar placement method on the uniaxial compression behavior of hollow concrete blocks
Influencia de la forma de colocación del mortero en el comportamiento a compresión uniaxial de los bloques huecos de concreto
Influência do método de aplicação da argamassa no comportamento à compressão uniaxial de blocos vazados de concreto
R. García-Cedeño1 , J. Álvarez-Pérez1*, M. Mesa-Lavista1, F. A. Carpio-Santamaría2, J. H. Chávez-Gómez1, R. González-Alcorta1, G. Fajardo-San Miguel1
1 Facultad de Ingeniería Civil, Universidad Autónoma de Nuevo León, Monterrey, México.
2 Instituto de Ingeniería, Facultad de Ingeniería Civil, Universidad Veracruzana, Boca del Río-Veracruz, México.
*Contact author: jose.alvarezpr@uanl.edu.mx
Received: 08/09/2023
Revised: 17/10/2024
Accepted: 29/11/2024
Published: 01/01/2025
| Cite as: García-Cedeño, R., Álvarez-Pérez, J., Mesa-Lavista, M., Carpio-Santamaría, F. A., Chávez-Gómez, J. H., González-Alcorta, R., Fajardo-San Miguel, G. (2025), “Influence of the mortar placement method on the uniaxial compression behavior of hollow concrete blocks”, Revista ALCONPAT, 15 (1), pp. 1 – 18, DOI:https://doi.org/10.21041/ra.v15i1.703 |
Abstract
The aim of this study was to evaluate how capping placement affects the uniaxial compressive behavior of hollow concrete blocks. Two placement methods were analyzed: 1) on the gross area and 2) on the lateral faces. An experimental program and statistical analysis were conducted to identify significant differences between the methods. The results showed that blocks capped on the lateral faces exhibited a 12.5% decrease in load capacity and an 11.33% decrease in stiffness compared to those capped on the gross area. This study focuses on hollow concrete blocks and concludes that using a variable denominator leads to a misinterpretation of their strength.
Keywords: masonry; hollow concrete blocks; mortar placement.
Nomenclature:
HCB: Hollow concrete block
: Compressive stress on the gross area of the HCB
: Compressive stress on the net area of the HCB
: Compressive stress on the lateral area of the HCB
: Modulus of elasticity on the gross area of the HCB
: Modulus of elasticity on the net area of the HCB
: Modulus of elasticity on the lateral area of the HCB
: Compressive load on the gross area of the HCB
: Compressive load on the lateral area of the HCB
; ; : Gross, net, and lateral areas of the HCB
: Strain corresponding to the maximum stress (mm/mm)
: Ultimate strain
: Unit weight
1. INTRODUCTION
Masonry is the construction material for multifamily housing and small- to medium-height social infrastructure. This material is composed of units (bricks or blocks) and mortar. Among the key variables to ensure a design (or review) that meets structural safety requirements are the uniaxial compressive strength and the modulus of elasticity of its components. In this context, the experimental and analytical procedures for obtaining these mechanical properties consider the mechanical properties of both the unit and the mortar. In masonry, the units is the most to contribute in the compressive strength of the composite material. However, it is well known that other variables influence the uniaxial compressive strength and the failure mode of masonry. These variables include: the type of unit (block/brick), slenderness, thickness, and the mortar placement method (Álvarez-Pérez, et al., 2020; Mohamad, et al., 2007; Caldeira, et al., 2020; Zahra, et al., 2021; Sarhat and Sherwood, 2014; Zahra and Dhanasekar, 2018). This article focuses on determining the uniaxial compressive strength and modulus of elasticity of hollow concrete blocks (HCB) using two capping methods. These two methods can be observed in Figure 1a, and are: 1) capping over the gross area of the HCB (commonly referred to as full-shell), and 2) capping on the lateral faces of the HCB (commonly referred to as face-shell).
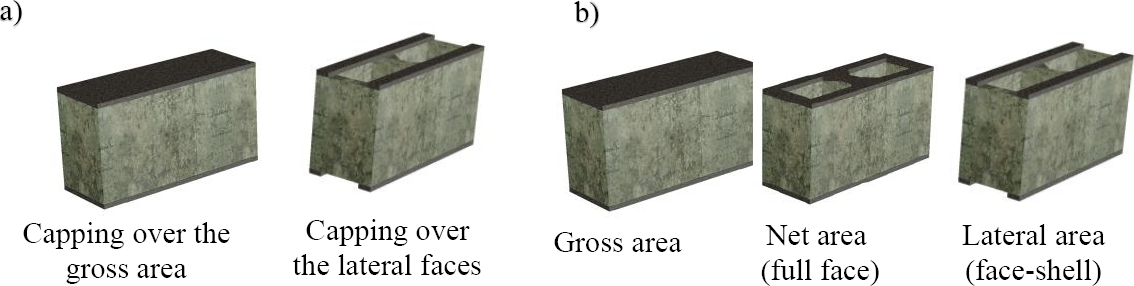
Figure 1. Representation of a) Different capping, b) Areas involved in the stress calculation. Source: Own elaboration.
The capping of HCB over the gross area is the experimental procedure established by standards (NMX-ONNCCE-C-036, 2010; TMS 602/ACI 530.1/ASCE 6, 2013) for determining the compressive strength and HCB modulus of elasticity, while capping on the lateral area is specified in other standards (S304.1-04, 2004; AS 3700, 2018) for hollow units.
The Mexican standards for design and construction of masonry (NTC-Masonry, 2023; NMX-ONNCCE-C-464, 2010) establish the placement of mortar on the net area of the HCB (Figure 1a). However, in professional practice, it is common to place mortar on the lateral faces of the HCB (Figure 2), a practice that has also been extended to other parts of the world (Sarhat and Sherwood, 2014; Lima, 2021).
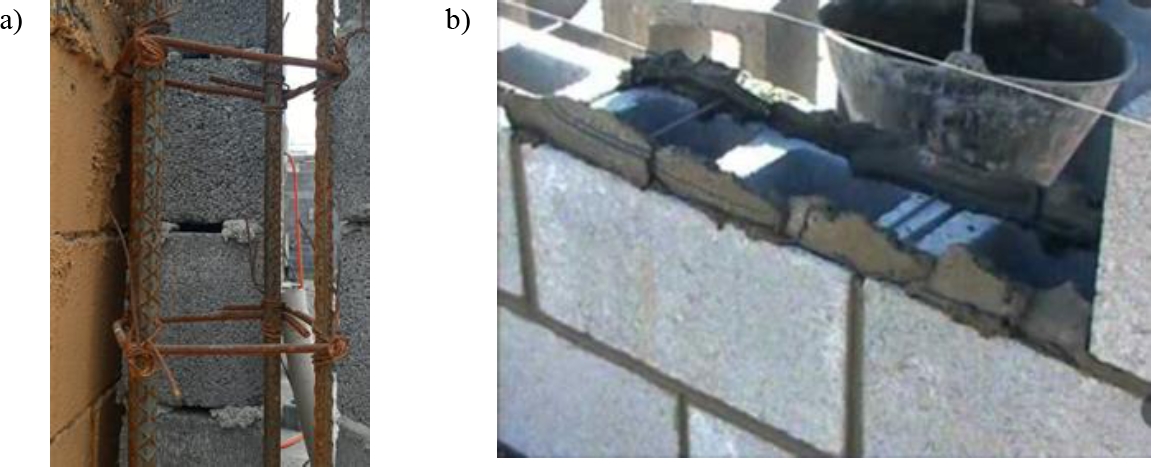
Figure 2. Examples of mortar on the lateral face in HCB masonry: a) finished wall, b) wall under construction. Source: Own elaboration.
National and international design standards show different approaches to mortar placement in masonry (Table 1).
Table 1. Main variables and expressions proposed by some masonry codes for determined compressive strength and elastic modulus of the HCB. Source: Own elaboration.
| Variable | Mexico (NMX-ONNCCE-C-036, 2013; NTC-Mampostería, 2023; NMX-ONNCCE-C-464, 2010; ASTM-C-1552, 2016) |
U.S.A. (TMS 602/ACI 530.1/ASCE 6, 2013; ASTM-C-140-17A, 2017; ASTM-C-1552, 2016) |
Canada (S304.1-04, 2004) |
| Capping on the HCB | Over the gross area |
Over the gross area |
Over the lateral face |
| Mortar placement for laying masonry in situ |  Over the net area |
 Over the net area |
 Over the lateral face |
| Compressive strength of the HCB | |||
| Elastic modulus of the HCB | Secant line at the 40% of the peak stress. | Secant line between 5% and 35% of the peak stress. | Secant line between 5% and 33% of the peak stress. |
: Correction factor for slenderness considers the influence of slenderness in estimating the uniaxial compressive strength of the specimen. The determination of the FC varies depending on the design codes.
: Compressive Stress over the gross area of the HCB
: Compressive Stress over the net area of the HCB
: Compressive Stress over the lateral faces área of the HCB
: Compressive load over the gross area of the HCB
: Compressive load over the gross lateral face area of the HCB
; ; : Gross area; net area and lateral face of the HCB respectively
For example, in Mexican standards (NMX-ONNCCE-C-036, 2013; NTC-Masonry, 2023; NMX-ONNCCE-C-464, 2010), it is established that mortar should be placed on the net area of the unit; however, the calculation of normal compressive stresses is carried out considering the gross area. On the other hand, the testing and design standards of the United States of America (TMS 602/ACI 530.1/ASCE 6, 2013; ASTM-C-140-17A, 2017; ASTM-C-1552, 2016) state that the average compressive stresses should be calculated based on the net area of the HCB. Additionally, Canadian standards (S304.1-04, 2004) specify in their construction guidelines the placement of mortar on the lateral faces of the unit when it is hollow or semi-solid.
In the specialized literature reviewed (Álvarez-Pérez, et al., 2020; Mohamad, et al., 2007; Caldeira, et al., 2020; Zahra, et al., 2021; Sarhat and Sherwood, 2014; Zahra and Dhanasekar, 2018; Mahamid and Westin, 2020; Thamboo, et al., 2013; Al-Amoudi and Alwathaf, 2014; Mohamad, 2017; Martins, et al., 2018; Fortes, et al., 2017; Barbosa, et al., 2010), there is limited information on the effects of the capping method on the compressive strength and modulus of elasticity of masonry units. The few studies on the mortar placement method have generally focused on the impact on two- (Sarhat, 2014) and three-course masonry prisms (Zahra, 2021). In this regard, only the work reported by Tatheer Zahra et al. constitutes the main precedent found in the literature on the impact of mortar capping on masonry units. Tatheer Zahra et al. (2021) studied the influence of capping on the uniaxial compressive strength of HCBs as part of a study on three-course HCB masonry prisms. They tested concrete blocks with two holes of nominal dimensions 390 x 190 x 90 mm (length x height x thickness) and with a net-to-gross area ratio of 0.74. To account for the two mortar placement variants, they used a capping method with 6 mm thick plywood strips to cover the gross and lateral areas of the HCBs. The results showed that the load applied to the gross area of the HCB was 28% higher than that applied to the lateral area, with this difference in terms of stresses reduced by 19.87% due to the differences between the areas .
From the bibliographic review conducted (Álvarez-Pérez, et al., 2020; Mohamad, et al., 2007; Caldeira, et al., 2020; Zahra, et al., 2021; Sarhat and Sherwood, 2014; Zahra and Dhanasekar, 2018; Mahamid and Westin, 2020; Thamboo, et al., 2013; Al-Amoudi and Alwathaf, 2014; Mohamad, 2017; Martins, et al., 2018; Fortes, et al., 2017; Barbosa, et al., 2010), three fundamental aspects are evident:
No investigations have been reported concerning the failure mode of the Hollow Concrete Block (HCB) and the Half Hollow Concrete Block (HHCB) based on the type of mortar placement. It is known that for the construction of a masonry wall, both HCB and HHCB are used in the lateral finishes of the wall. In this regard, it is assumed that the differences in the mechanical behavior between the HCB and HHCB are not significant.
The reported results focus on the uniaxial compressive behavior of two- and three-course masonry prisms.
There is no consensus on which area of the HCB should be used to determine the compressive strength and modulus of elasticity of masonry units.
The compressive strength of HCB is the primary mechanical parameter used as a quality control index for masonry units (S304.1-04, 2004; NTC-Masonry, 2023; Eurocode, 2005). Moreover, the selection of a masonry unit for structural use fundamentally depends on its compressive strength. Additionally, it is known that the compressive strength of masonry depends on both the mortar and the unit, with the unit being the most determining factor (Eurocode, 2005; Barbosa and Hanai, 2005).
For this reason, the objective of this research was to evaluate how the mortar capping method influences hollow concrete blocks, analyzing its impact on uniaxial compressive strength and modulus of elasticity. The hypothesis posits that the capping arrangement significantly affects the uniaxial compressive behavior of these blocks.
2. EXPERIMENTAL TESTS
2.1. Materials
The HCBs used in this study were randomly selected from a single manufacturer. They are blocks made with a double-cell cement-sand mix, with a maximum coarse sand size of 3/8. Their nominal dimensions were 390 mm x 190 mm x 150 mm (length x height x thickness), as shown in Table 2. As part of the experimental program, 20 HCBs were tested for uniaxial compression (Table 2), divided into two groups: 10 HCBs with the capping on the gross area, as indicated in the reference (NMX-ONNCCE-C-036, 2013), and 10 HCBs with capping on the lateral faces.
Table 2. Average of the geometrical and mechanical properties of HCB. Source: Own elaboration.
 |
|||||||||
| 19300 | 333.6 | 580 | 222.0 | 0.57 | 0.66 | 0.38 | |||
| 39.50 | 14.70 | 27 | 100 | 56 | 31 | 57 | 100 | 27 | 19.50 |
To ensure proper load distribution on the test specimens (HCBs), all the pieces were bedded using a combination of sulfur and fly ash. A 2:1 ratio (sulfur: fly ash) was used, achieving an average uniaxial compressive strength of 45.6 MPa for the capping material, meeting the requirements established by NMX-C-036 (2013). The HCBs were stored in the laboratory at a temperature of and with a relative humidity lesser than 80%.
2.2. Instrumentation
For the execution of the tests, an INSTRON DX 600 machine with a load capacity of 60 tons was used. The block tests were performed under displacement control at a 0.006 mm/s speed. To ensure proper leveling and load distribution, a spherical seat and 5 cm thick steel plates were used (Figure 3a). Strain gauges and two displacement transducers (LVDTs) were placed on the specimens to obtain the stress-strain curves. The strain gauges were placed one in the vertical position and the other in the horizontal position. In this way, horizontal and transverse deformations were obtained for the subsequent determination of Poisson's ratio (Figure 3b).
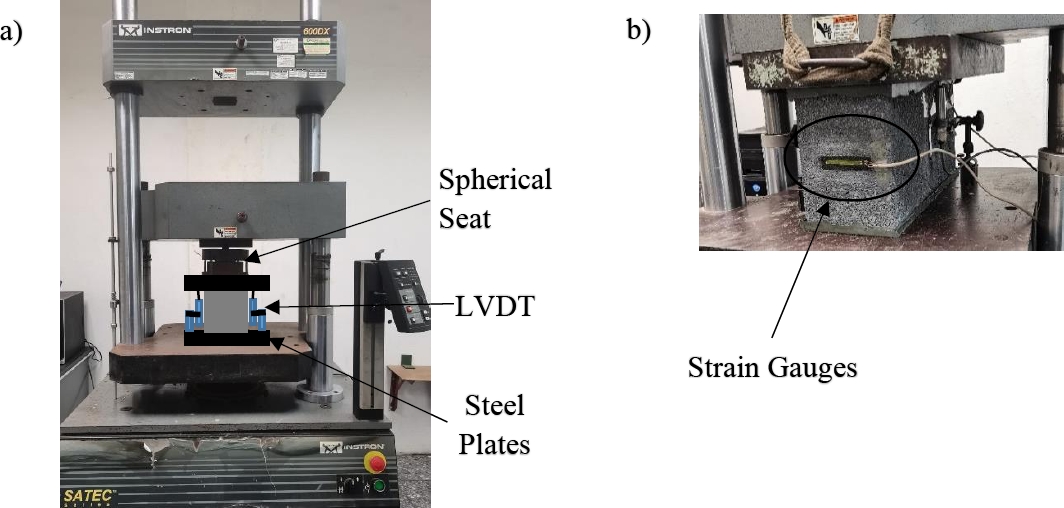
Figure 3. a) Instrumentation for the compression test of the HCB; b) Location of strain gauges. Source: Own elaboration.
3. EXPERIMENTAL RESULTS
3.1. Hollow Concrete Blocks (HCB)
Figure 4 shows the average experimental results of the load vs. displacement curves for the two capping methods used.
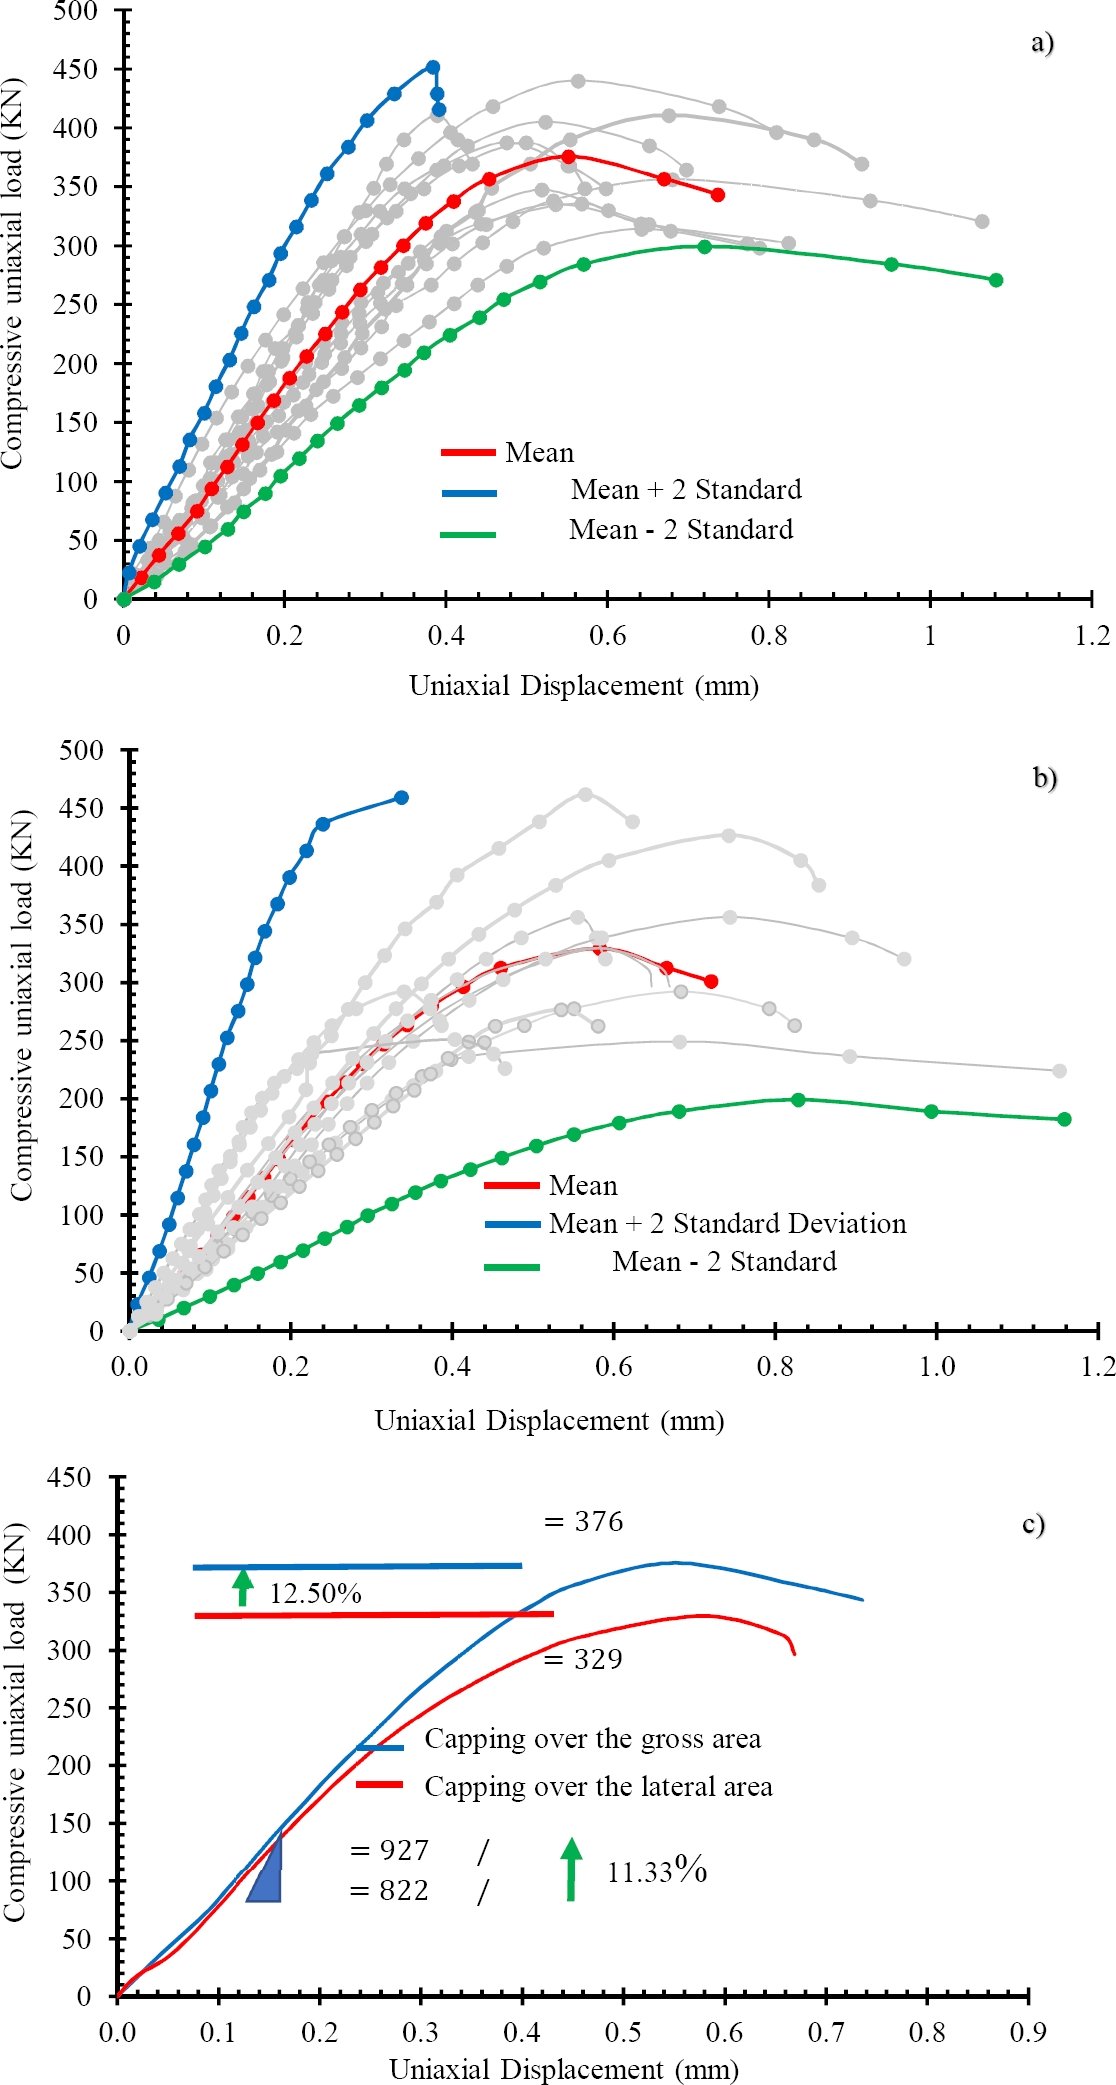
Figure 4. Load vs Displacement curves: a) capping over the gross area, b) capping over the lateral face area, c) experimental Means and relative differences. Source: Own elaboration.
The main variables that characterize the load vs. displacement curve are presented in Table 3. To calculate the relative differences between the variables, the values obtained from the capping on the gross area were used as a reference, since this is the procedure established by the Mexican standard (NMX-ONNCCE-C-036, 2013).
Table 3. Average experimental results obtained from load-displacement curves for HCB. Source: Own elaboration.
| Parameters from load vs displacement curves | Load application over the gross area capping | Load application over the lateral face area capping | |
| Maximum load | 376 (0.1) | 329 (0.12) | +12.50 |
| HCBStiffness | 927 (0.19) | 822 (0.10) | +11.33 |
| Displacement at maximum load | 0.55 (0.15) | 0.64 (0.10) | -16.36 |
| Maximum displacement | 0.79 (0.23) | 0.80 (0.20) | -1.27 |
| 1.44 | 1.25 | +13.19 |
: Slope at the secant line at the 40% of the maximum load.
: Relative differences using as pattern the capping over gross area.
: Coefficient of variation (Standard deviation / arithmetic mean)
As shown in Table 3, when the load is applied to the HCB with capping on the gross area, the load capacity and stiffness (K) increase by 12.5% and 11.33%, respectively, compared to the capping on the lateral area.
The experimental results presented (Table 3 and Figure 4) indicate that the placement of the capping on the lateral area in HCB results in a decrease in the main variables that characterize the experimental curve load vs. displacement.
This result is similar to that obtained by Zahra et al. (2021), where it was found that HCB with mortar placed on the lateral faces showed a decrease in load capacity of 19.87%. The differences obtained in that study were greater than those of the present study because the geometry of the HCB and the capping material were different in both investigations.
On the other hand, due to the differences between the areas of the HCB (Table 2), the estimation of the average stresses varies notably (see Table 4), generating a high degree of uncertainty in the reliability of the concept of average stress. This average stress is used as a measure of strength and Young’s modulus in the units, prisms, and wallettes of HCB masonry.
Table 4. Different measures of average ultimate stress (strength). Source: Own elaboration.
| Stress Load |
||||||
| (COV) | 376 (0.1) | 6.48 | 11.27 | 16.94 | 11.27 | - |
| 329 (0.12) | 5.67 | 9.86 | 14.82 | - | 14.82 | |
| +12.50 | -31.50 | |||||
; : Applied load in capping over the gross area and lateral face area respectively.
: Coefficient of variation (Standard deviation / arithmetic mean)
: Relative differences using pitch over gross area
: Relative differences using pitch over net area
In columns 1-3 of Table 4, it can be seen that the compressive strengths of the HCB (), obtained with the same common denominator (), decrease when the capping is applied to the lateral area of the HCB. Furthermore, a relative difference value of is obtained, which matches the value presented in the first row of Table 3, based on the maximum load applied.
In this regard, the obtained strengths are consistent with the experimental results presented in Table 3, where the capping applied to the gross area showed a 12.50% increase in the maximum load achieved by the HCB compared to the capping applied to the lateral area.
The problem arises when reporting the strength values obtained with a variable denominator , as seen in columns 4 and 5 of Table 4. In this case, the strength is higher than , which could lead to a misinterpretation that, when the capping is applied to the lateral area, the HCB performs better than when applied to the net area, presenting a relative difference of . This result opposes the experimental value shown in the first row of Table 3.
Recently, other authors (Zahra, 2021) have presented this issue for both solid and hollow blocks. In their experimental results (Zahra, 2021), the compressive strength of the HCB was measured as the ratio between the load and the lateral area . However, when applying the plastic damage model for concrete, they used the stresses calculated based on the net area , due to the fictitious increase in the HCB's strength generated by the metric based on the lateral area .
The Mexican standards (NMX-ONNCCE-C-036, 2013; NTC-Mampostería, 2023) state that the strength of the HCB is defined as the ratio between the load and the gross area . On the other hand, other standards (TMS 602/ACI 530.1/ASCE 6, 2013; ASTM-C-140-17A, 2017) propose that strength be calculated as the ratio between the load and the net area , arguing that, since it is a hollow unit, the net area is the effective region in the mechanical work.
Figure 5 shows the stress vs. strain curves according to the measurement criteria of the Mexican standards (NMX-ONNCCE-C-036, 2013; NTC-Mampostería, 2023) with the confidence interval of two times the standard deviation. Additionally, Table 5 shows the main average deformational mechanical parameters extracted from the stress vs. strain curves.
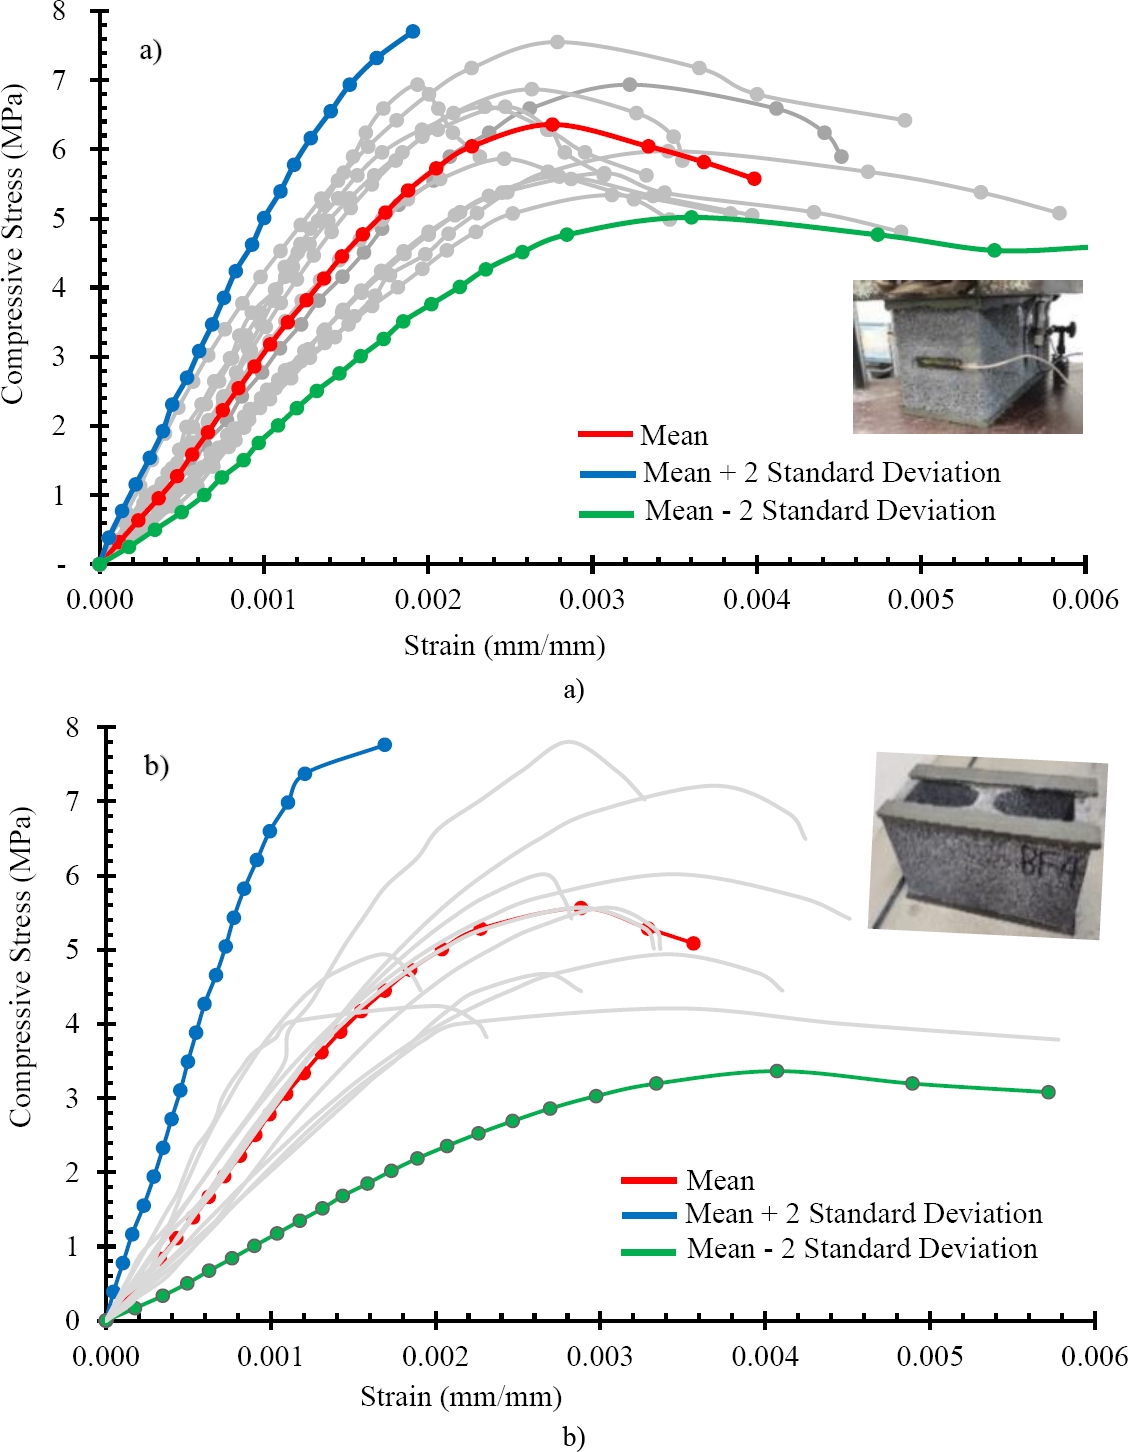
Figure 5. Stress vs Strain curves of the HCB a) according to Mexican regulations (NMX-ONNCCE-C-036, 2013; NTC-Masonry, 2023) over the gross area, b) over the lateral face area. Source: Own elaboration.
Table 5. Main parameters obtained from stress vs strain curves of HCB. Source: Own elaboration.
| Capping over gross area | Capping over lateral face area | Elastic Modulus | ||||||
| Over gross area | 3099 (0.22) |
0.0027 (0.15) |
0.0039 (0.23) |
- | - | - | - | 3099 (0.22) |
| Over lateral face area | 2680 (0.24) |
0.0029 (0.16) |
0.0036 (0.28) |
6844 (0.16) |
0.0031 (0.10) |
0.0039 (0.24) |
6844 (0.16) |
- |
| 13.52 | -7.41 | 7.69 | ||||||
: Relative differences using as pattern the gross area
: Relative differences of the elastic modulus, using as pattern the lateral face area
The elastic modulus was calculated according to a tangent line at 40% of the peak stress, following the guidelines established in the Mexican standards (NMX-ONNCCE-C-036, 2013; NTC-Mampostería, 2023). Similarly, in the estimation of the strength of the HCB, Table 5 shows that using the lateral area in the average stress measurement leads to an increase of more than 50% in the estimated Young's modulus of the HCB. However, the strains did not show significant differences for both capping methods.
Regarding the failure modes of the HCBs, the experimental results showed that, in the capping over gross area, the cracking process began to develop at the corners of the HCB (Figure 6a). Subsequently, the cracks started to propagate diagonally toward the center of the HCB faces (Figures 6b and 6c), causing segments of the material to detach (Figure 6d). None of the specimens exhibited explosive failure; instead, failure was accompanied by the extension of the diagonal cracks originating at the block's edges. This failure mode is typical of commercially HCBs and is associated with a combination of factors, such as the confinement effect imposed by the steel plates at the ends of the HCB (Figure 3), the low slenderness ratio of the HCB, the low tensile strength of the material, and the distribution of principal stresses (Barbosa and Hanai, 2005; García et al., 2013).
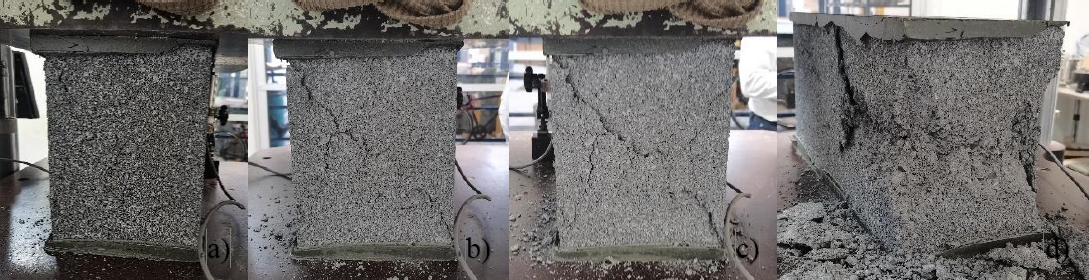
Figure 6. Stages of the cracking process of the HCB capping over gross area: a) Cracking begin at the corners of the block, b) and c) development of cracks towards the center of the block faces, d) detachment of segments of the material. Sources: Own elaboration.
In the capping over the lateral faces, the localized geometry of the capping caused high stress concentrations in the lateral faces of the HCB (Figure 7a), initiating the cracking process. Subsequently, the cracks began to develop more predominantly along the longer walls of the HCBs (395 mm in length) due to stress concentration on the lateral faces. The failure of the HCBs spanned two interconnected zones. The first zone was located on the longer walls and originated due to local stability loss caused by stress concentration effects (Figure 7b). The second zone developed later, involving another cracking process that originated in the shorter walls (147 mm in thickness) due to the low tensile strength of the HCB (Figure 7c).
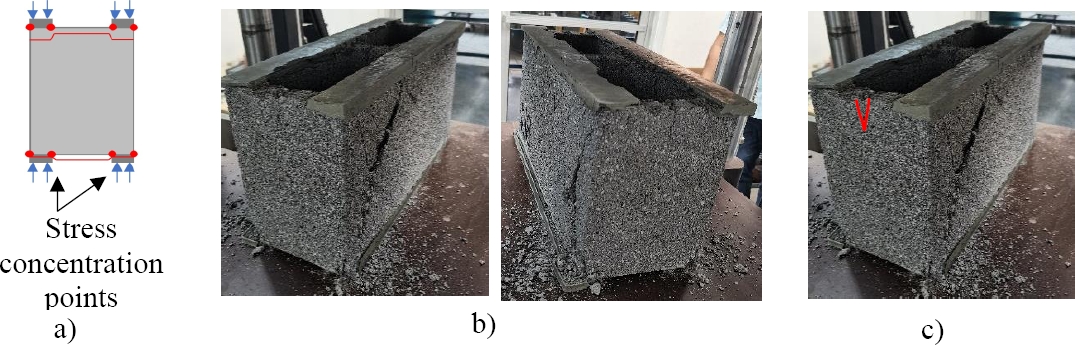
Figure 7. Stages of the cracking process of the HCB capping over lateral face area: a) Stress concentration scheme, b) zone 1, development of cracks on the HCB face, c) zone 2, development of cracks on the HCB shorts face. Source: Own elaboration.
Research from other authors shows that as the height of the specimens increases (multi-course prisms), the cracking process in the second zone becomes more significant (Figure 7c) (Zahra, 2021; Nalon et al., 2022; Henrique Nalon et al., 2020).
Figure 8 presents a summary comparative graphic of the average experimental curves based on the three most commonly used approaches in the literature for estimating average stresses in HCBs (S304.1-04, 2004; ASTM-C-140-17A, 2017), like: average stresses on the gross area , average stresses on the net area , and average stresses on the lateral area . It can be observed that the estimation of the strength and Young's modulus of the HCB can vary by more than 50%.
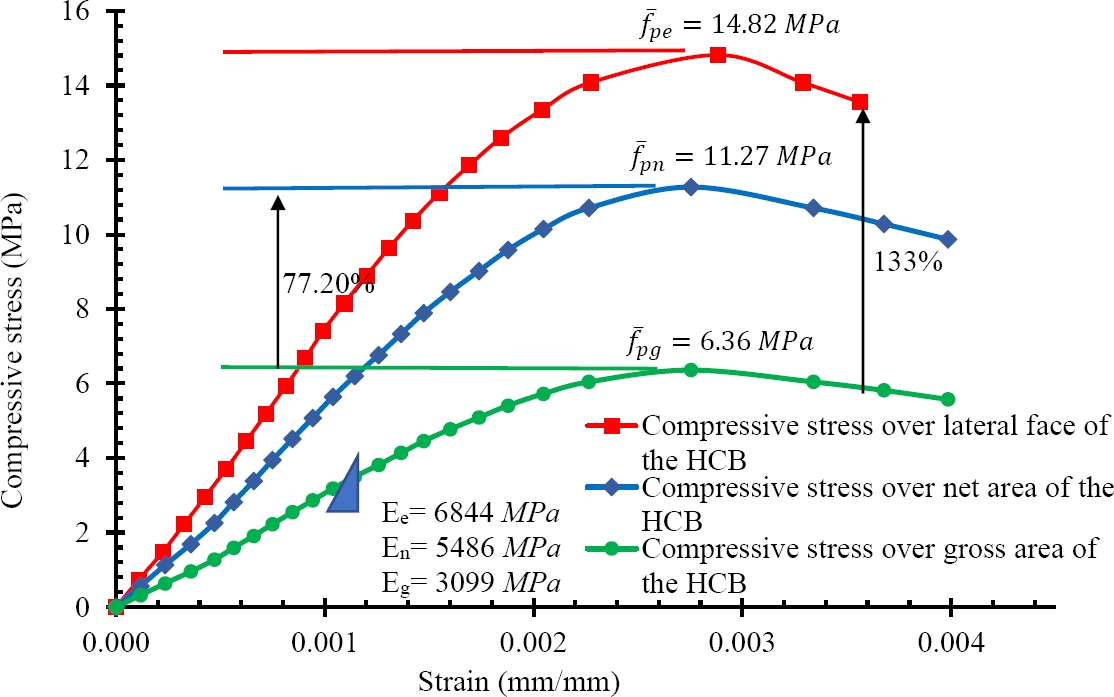
Figure 8. Compressive stress vs strain experimental mean curves obtained for both capping methods. Source: Own elaboration
4. STATISTICAL ANALYSIS
This section presents the statistical analysis of the significant differences among the main average mechanical parameters derived from the stress-strain curves (Figure 8).
First, the Kolmogorov-Smirnov and Shapiro-Wilk normality tests were performed to assess whether the samples fit a normal distribution. Table 6 shows that the significance value (sig.) of the analyzed samples (12 random variables) was greater than the assumed significance level (α = 0.05), indicating that the random variables follow a normal distribution (Montgomery and Runger, 2003; SPSS, 2017).
Table 6. Normality tests. Source: Own elaboration.
| Variable | N | Mean | COV (%) |
Kolmogorov-Smirnova | Shapiro-Wilk | ||||
| Statistic | gl. | Sig. | Statistic | gl. | Sig. | ||||
| 10 | 11.50 | 0.10 | 0.202 | 6 | 0.200* | 0.933 | 6 | .604 | |
| 10 | 14.90 | 0.12 | 0.268 | 6 | 0.200* | 0.878 | 6 | .261 | |
| 10 | 6.50 | 0.10 | 0.250 | 6 | 0.200* | 0.895 | 6 | .347 | |
| 10 | 5486 | 0.21 | 0.229 | 6 | 0.200* | 0.873 | 6 | .238 | |
| 10 | 6844 | 0.16 | 0.196 | 6 | 0.200* | 0.957 | 6 | .800 | |
| 10 | 3099 | 0.22 | 0.212 | 6 | 0.200* | 0.883 | 6 | .282 | |
| 10 | 0.0027 | 0.15 | 0.180 | 6 | 0.200* | 0.959 | 6 | .814 | |
| 10 | 0.0031 | 0.10 | 0.307 | 6 | 0.080 | 0.827 | 6 | .102 | |
| 10 | 0.0027 | 0.10 | 0.180 | 6 | 0.200* | 0.959 | 6 | .814 | |
| 10 | 0.0039 | 0.23 | 0.226 | 6 | 0.200* | 0.938 | 6 | .644 | |
| 10 | 0.0039 | 0.24 | 0.206 | 6 | 0.200* | 0.936 | 6 | .627 | |
| 10 | 0.0031 | 0.28 | 0.226 | 6 | 0.200* | 0.938 | 6 | .644 | |
a. Correction of meaning of Lilliefors
*. Lower limit of true significance.
Subsequently, Levene's tests for homogeneity of variances were conducted to determine whether parametric or non-parametric hypothesis tests were more suitable for identifying statistically significant differences. As shown in Table 7, all hypothesis tests conducted were parametric (Student-t tests), thereby increasing the power of measuring statistically significant differences.
Table 7. Parametric hypothesis test (t-Student). Source: Own elaboration.
| Random variables | Levene Test p-value | Comparison means Sig.(bilateral) | Statistical differences |
| Mechanical parameters over gross area vs net area | |||
| 0.051 | Student-t test |
significant | |
| 0.078 | Student-t test |
significant | |
| 1.000 | Student-t test |
Not significant | |
| 1.000 | Student-t test |
Not significant | |
| Mechanical parameters over gross area vs lateral face area | |||
| 0.087 | Student-t test |
significant | |
| 0.370 | Student-t test |
significant | |
| 0.248 | Student-t test |
Not significant | |
| 0.736 | Student-t test |
Not significant | |
The statistical analysis indicated that the strains corresponding to the peak stress, as well as the ultimate strains for both capping methods, did not show statistically significant differences (Table 7, Figure 9). Additionally, mechanical parameters such as uniaxial compressive strengths and Young's moduli exhibited statistically significant differences (Table 7).
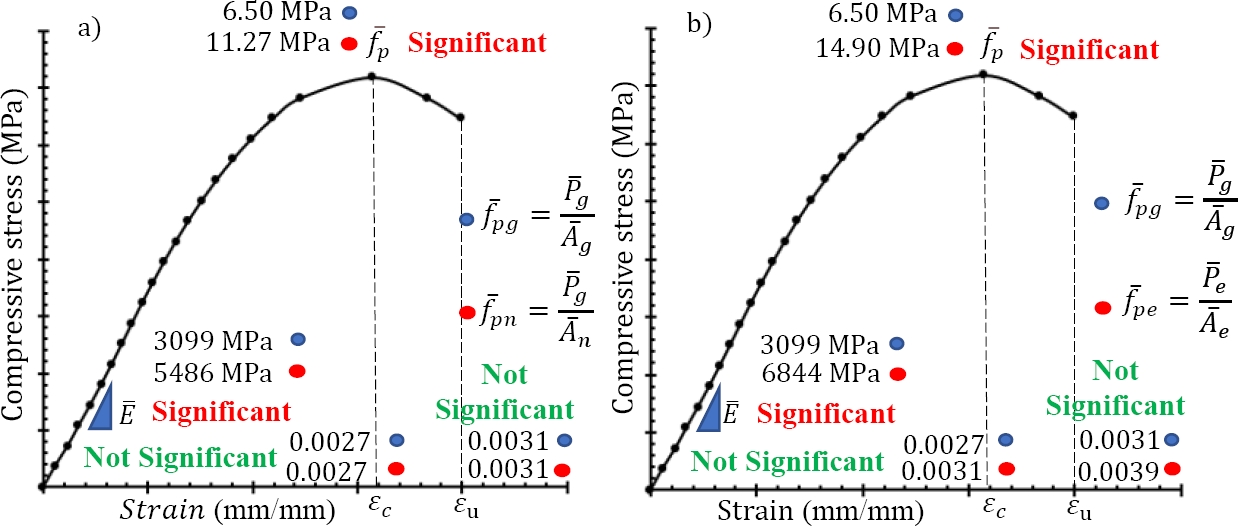
Figure 9. Statistical differences between mechanical parameters of compressive stress vs strain of the HCB: a) gross area vs net area, b) gross area vs lateral face area. Source: Own elaboration.
Conclusions
The following conclusions of this study address the general objective and validate the proposed hypothesis:
The placement of the capping method significantly influenced the uniaxial compressive behavior of the hollow concrete blocks (HCBs). Capping over the lateral area of the HCB caused a statistically significant decrease in both the load-carrying capacity and the stiffness of the HCB.
Due to the differences between the derived from the geometry of the HCB, the calculation of average uniaxial stresses varies significantly, generating high uncertainty in the reliability of the concept of average stress as a measure of the compressive strength and elastic modulus of masonry units. The strengths of the HCB (), calculated with a consistent denominator () decrease when the capping is applied on the lateral area of the HCB, showing coherence with the experimental results presented in terms of load vs displacement. However, comparing the strengths calculated using a variable denominator , leads to a misinterpretation of the HCB strength.
The cracking processes for both capping methods resulted in different failure mechanisms, with greater ductility observed in the HCB capped on the gross area.
5. ACKNOWLEDGMENTS
The first author acknowledges CONAHCYT for the doctoral scholarship, as well as the Department of Structural Engineering and Expert Assessments and the Postgraduate Sub direction of the Faculty of Civil Engineering at UANL.
The authors also express their gratitude to the PAICYT program offered by UANL.
6. REFERENCE
Álvarez-Pérez, J., Chávez-Gómez, J. H., Terán-Torres, B. T., Mesa-Lavista, M., Balandrano-Vázquez, R. (2020), Multifactorial behavior of the elastic modulus and compressive strength in masonry prisms of hollow concrete blocks. Construction and Building Materials, 241: p. 18. https://doi.org/10.1016/j.conbuildmat.2020.118002
Al-Amoudi, M. A. A., Alwathaf, A. H. (2014), The Behavior of Hollow Concrete Block Masonry under Axial Compression. Journal of Engineering Sciences, 3(2): p. 32-53. ISSN 2312-9999.
American Society for Testing and Materials International (2017), ASTM-C-140-17A, Standard test methods for sampling and testing concrete masonry units and related units. p. 26.
American Society for Testing and Materials International (2016), ASTM-C-1552, Standard Practice for Capping Concrete Masonry Units, Related Units and Masonry Prisms for Compression Testing.
Australian Standard (2018), AS 3700:2018, Masonry Structures, Standarsds Australian Limited 2018.
Barbosa, C. S., Hanai, J. B. (2005), Strength and deformability of hollow concrete blocks and their correlations with mechanical properties of constituent material, in 10th Canadian Masonry Symposium. Banff, Alberta, June p. 8-12.
Barbosa, C. S., Hanai, J. B. (2006), Resistência e deformabilidade de blocos vazados de concreto e suas correlações com as propriedades mecânicas do material constituinte. Cadernos de Engenharia de Estruturas. 8(34): p. 45-74.
Barbosa, C. S., Lourenço, P. B., Hanai, J. B. (2010), On the compressive strength prediction for concrete masonry prisms. Materials and Structures, 43(3): p. 331-344. http://dx.doi.org/10.1617/s11527-009-9492-0
Caldeira, F. E. et al. (2020), Influence of joint thickness and strength of mortars on the compressive behavior of prisms made of normal and high-strength concrete blocks. Construction and Building Materials, 234: p. 117419. https://doi.org/10.1016/j.conbuildmat.2019.117419
Canadian Standards Association (CSA) (2004), S304.1-04 - Design of Masonry Structures, p. 139, Published in December, Canada, ISBN 1-55397-402-6. https://es.slideshare.net/slideshow/csa-masonry-s304104/238765983
Eurocode (2005), EN 1996-1 and 2: 2005, Eurocode 6-Design of masonry structures. Part 1-1: General rules for buildings—reinforced and unreinforced masonry, Design of asonry structures. Design Considerations, Selection of Materials and Execution o Masonry. European Committee for Standardisation CEN, Brussels, 2006.
Fortes, E. S., Parsekian, G. A., Camacho, J. S. (2017), Compressive strength of masonry constructed with high strength concrete blocks. Ibracon structures and materials journal, 10(6): p. 1273-1319. http://dx.doi.org/10.1590/S1983-41952017000600008
García, J. M., Bonett, R. L., Ledezma, C. (2013), Analytical Model for Compression Behavior of Hollow Concrete Blocks (In Spanich). Revista de la construcción, 12(3): p. 76-82. http://dx.doi.org/10.4067/S0718-915X2013000300009
Henrique Nalon, G., Rezende Santos, C. F., Pedroti, L. G., Lopes Ribeiro, J. C., Veríssimo, G. S., Ferreira, F. A. (2020), Strength and failure mechanisms of masonry prisms under compression, flexure and shear: Components’ mechanical properties as design constraints. Journal of Building Engineering, 28: p. 101038. https://doi.org/10.1016/j.jobe.2019.101038
Lima, T. E. S., Azevedo, A. R. G., Marvila, M. T., Zanelato, E. B., Paes, A. L. C., Alexandre, J., Monteiro, S. N. (2021), Study of Face Shell Bedding Concrete Blocks Prisms with Different Laying Mortar Strength. in Characterization of Minerals, Metals, and Materials 2021. Cham: Springer International Publishing. https://doi.org/10.1007/978-3-030-65493-1_52
Mahamid, M., Westin, N. (2020), Reevaluation of f´m for the Unit-Strength Method with Application to Ligthweight Concrete Block Masonry and Face Shell-Bedded Mortar Joints. Practice Periodical on Structural Design and Construction, 25(3): p. 10. https://10.1061/(asce)sc.1943-5576.0000494
Martins, R. O. G., Nalon, G. H., Sant'Ana Alvarenga, R. C. S., Pedroti, L. G., Lopes Ribeiro, J. C. (2018), Influence of blocks and grout on compressive strength and stiffness of concrete masonry prisms. Construction and Building Materials, 182: p. 233-241. https://doi.org/10.1016/j.conbuildmat.2018.06.091
Masonry Standards Joint Committee (MSJC) (2013), Building Code Requirements and Specification for Masonry Structures and Companion Commentaries (TMS 602/ACI 530.1/ASCE 6). Produced in the United States of America.
NTC-Mampostería (2023), Norma técnica complementaria para diseño y construcción de estructuras de mampostería. p. 119.
Mohamad, G., Fonseca, F. S., Vermeltfoort, T., Martens, D. R. W., Lourenço, P. B. (2017), Strength, behavior, and failure mode of hollow concrete masonry constructed with mortars of different strengths. Construction and Building Materials, 134: p. 489-496. https://doi.org/10.1016/j.conbuildmat.2016.12.112
Montgomery, D. C., Runger, G. C. (2003), Applied Statistics and Probability for Engineers, Third Edition: Printed in the United States of America.
Mohamad, G., Lourenço, P. B., Roman, H. R. (2007), Mechanics of hollow concrete block masonry prisms under compression: Review and prospects. Cement and Concrete Composites, 29(3): p. 181-192. https://doi.org/10.1016/j.cemconcomp.2006.11.003
Nalon, G. H., Lopes Ribeiro, J. C., Pedroti, L. G., da Silva, R. M., Duarte de Araújo, E. N., Santos, R. F., Soares de Lima, G. E. (2022), Review of recent progress on the compressive behavior of masonry prisms. Construction and Building Materials, 320: p. 126181. https://doi.org/10.1016/j.conbuildmat.2021.126181
Organismo Nacional de Normalización y Certificación de la Construcción y Edificación – ONNCCE (2010), NMX-ONNCCE-C-464, Determinación de la resistencia a compresión diagonal y módulo de cortante de muretes, así como determinación de la resistencia a compresión y módulo de elasticidad de pilas de mampostería de arcilla o de concreto. Métodos de ensayo. p. 24.
Organismo Nacional de Normalización y Certificación de la Construcción y Edificación – ONNCCE (2013), NMX-ONNCCE-C-036, Resistencia a la compresión de bloques, tabiques o ladrillos y tabicones y adoquines– método de ensayo. p. 10.
Sarhat, S. R., Sherwood, E. G. (2014), The prediction of compressive strength of ungrouted hollow concrete block masonry. Construction and Building Materials, 58: p. 111-121. https://doi.org/10.1016/j.conbuildmat.2014.01.025
"software">SPSS (2017), IBM SPSS Statistics for Windows, Version 25.0., N.Y. Armonk, Editor.
Thamboo, J. A., Dhanasekar, M., Yan, C. (2013), Effects of Joint Thickness, Adhesion and Web Shells to the Face Shell Bedded Concrete Masonry Loaded in Compression. Australian Journal of Structural Engineering, 14(3): p. 291-302. https://10.7158/13287982.2013.11465139.
Zahra, T., Thamboo, J., Asad, M. (2021), Compressive strength and deformation characteristics of concrete block masonry made with different mortars, blocks and mortar beddings types. Journal of Building Engineering, 38: p. 102213. https://doi.org/10.1016/j.jobe.2021.102213
Zahra, T., Dhanasekar, M. (2018), Characterisation and strategies for mitigation of the contact surface unevenness in dry-stack masonry. Construction and Building Materials, 169: p. 612-628. https://doi.org/10.1016/j.conbuildmat.2018.03.002