![]()
| Basic Research | https://doi.org/10.21041/ra.v15i1.732 |
Evaluation of the carbonated front in concrete samples subjected to non-regular wetting-air drying cycles
Evaluación del frente de carbonatación de una estructura de hormigón sometida a hollín de fuego
Avaliação da alteração da frente de carbonatação de estrutura de concreto submetida a fuligem de incêndio
A. Guzmán1* , S. Acosta1, C. Dagne1
1 CeReDeTeC (Centro Regional de Desarrollos Tecnológicos para la Construcción, Sismología y la Ingeniería Sísmica), Facultad Regional Mendoza, Universidad Tecnológica Nacional, Mendoza Argentina.
*Contact author: mguzman@frm.utn.edu.ar
Received: 04/03/2024
Revised: 06/11/2024
Accepted: 13/12/2024
Published: 01/01/2025
| Cite as: Guzmán, A., Acosta, S., Dagne, C. (2025), "Evaluación del frente carbonatado en muestras de hormigón sujetas a ciclos no regulares de humedecimiento-secado al aire.", Revista ALCONPAT, 15 (1), pp. 35 – 49, DOI: https://doi.org/10.21041/ra.v15i1.732 |
Abstract
The objective of this research is to experimentally evaluate how certain characteristics of the concretes under study influence the carbonation phenomenon. To do this, concretes are prepared with three w/c ratios, two types of cement, and with the incorporation of a water-repellent additive, then exposed to air-drying and wetting for a period of 6 years. From the results obtained, the correspondence of the advance of the carbonate front with the tensile strength was observed, as well as its dependence on the design characteristics and the particularities of the exposure condition.
Keywords: reinforced concrete; carbonation; corrosion; durability.
1. INTRODUCTION
The degradation of reinforced concrete structures associated with reinforcement corrosion mechanisms is very significant. This results in high costs for the repair of the affected structures. Studies carried out in the region, for example in Argentina (Di Maio et al., 2009) and Brazil (Dal Molin, 1988), have established a high incidence of structural degradation associated with corrosion over other deterioration mechanisms. But by nature, concrete has a high pH, which allows under this condition to passivate the embedded reinforcements, thus protecting them from the development of corrosive processes. The advance of the carbonation front (due to CO2 penetration) results in the loss of alkalinity in the concrete, thus producing the depassivation of the reinforcements and allowing the possible development of corrosion in the steel, which leads to concrete degradation. This situation is due to the fact that when a steel bar corrodes, the resulting volume is approximately six times that of the iron it replaces when the bar is not corroded (Marcotte, 2001). This causes high tensile stresses to occur at the reinforcement/concrete interface, which leads, among other things, to cracking and loss of the concrete cover. Figure 1 shows the products resulting from the corrosion of iron.
Figure 1. Products resulting from the corrosion of iron (Marcotte, 2001).
This is why the concrete covering the reinforcement plays a fundamental role, being of vital importance in mitigating the phenomenon of corrosion. This offers the embedded bars double protection. On the one hand, it is a physical barrier separating them from the environment. On the other hand, the liquid enclosed in the concrete pore solution has a high alkalinity (pH ~ 12 to 13), being an electrolyte capable of forming a protective oxide layer around the rebars. This passivating layer, which is compact and invisible, adheres strongly to the rebars (Irassar, 2001), preventing the contact of the rebars with moisture and oxygen. But when the natural alkalinity of the concrete is compromised due to the phenomenon of carbonation, the rebars are homogeneously depassivated over their entire surface, giving rise to generalized corrosion. However, the advance of the carbonate front is sensitive to the microclimate to which the structure is exposed. Castro et al. (2000) evaluated the carbonation of concrete in the Gulf of Mexico, pointing out the importance of considering the different marine microenvironments that can be constituted, for example, as a consequence of the distance from the coast. The latter affects the progression of carbonation, and consequently, it is not logical to establish general recommendations based on the exposure of specimens in a single microenvironment.
In this sense, the moisture content of the concrete conditions the speed at which CO2 penetrates. In this regard, Houst and Wittmann (2002) in their research were able to establish that the depth of the carbonation front was greater when the mortar surfaces exposed to the exterior were protected from rain, favoring the diffusion of CO2. Similar results were obtained by Priano and Señas (2013) when they evaluated the carbonation of concrete structures located in urban and rural environments.
They were able to establish that the deterioration of a reinforced concrete element depends on the microclimate of exposure, since this can vary for different zones of the same element, and thus, on the available humidity. On the other hand, another conditioning factor for the advance of the carbonation phenomenon is due to the design characteristics of the elements. A higher w/c ratio contributes to a greater depth of the carbonation front (Rao and Meena, 2017), while the use of cements with mineral additions can decrease the resistance to carbonation (Leemann et al., 2015).
The present research deals with the qualitative evaluation of the carbonation phenomenon from measurements obtained in concrete specimens, and at the same time, its correspondence with the surface appearance of an embedded steel bar at the time of molding each one of them. The objective is to evaluate the effect on the advance of the carbonate front of: i) the quality of the concrete, inferred from the evaluation of the diametral compressive strength, assuming the relationship of the latter with the compressive strength; ii) the type of cement used; iii) the incorporation of a water-repellent additive; and iv) the particular condition of environmental exposure to which the samples were subjected during an uninterrupted period of 6 years. This exposure condition corresponded to non-regular wetting-air-drying cycles. The time of exposure to each particular condition was not a variable considered in the study. It should be noted that approximately every two months the water level in the containers where the samples were housed was renewed.
It should be clarified that the present development is the continuity of previously conducted research (Guzmán et al., 2018; Guzmán et al., 2019; Guzmán, 2023), in which the electrical resistivity of the concrete and the corrosion potential developed were evaluated in these cases.
2. CARBONATION OF CONCRETE
As mentioned above, the liquid enclosed in the pore solution of the concrete coating and given its high alkalinity, allows the preservation of a protective oxide layer around the rebars, known as passive film. In the presence of moisture and oxygen, this passive film prevents the dissolution of the iron, thus making corrosion of the rebars impossible. However, this protection can disappear when the passive film is destroyed as a result of the loss of alkalinity (pH < 9) of the coating concrete (Behnood et al., 2016). The phenomenon of carbonation of the concrete is one of the causes of such depassivation.
Carbonation occurs when carbon dioxide from the air (CO2) enters the concrete through its pores. It reacts with the hydroxides in the interstitial liquid phase and with the hydrated compounds in the cement. Thus, calcium hydroxide (Ca(OH)2), sodium hydroxide (Na(OH)) and potassium hydroxide (K(OH)) in the pore solution carbonate. These reactions can be simplified from the following equations (Broomfield, 2023):
| (1) |
| (2) |
Thus, the acidification of the concrete pore solution (Pu et al., 2012) caused by carbonation breaks down the passive layer of the steel reinforcement and corrosion of the reinforcement is initiated.
It should be noted that unlike most other acids, carbonic acid does not attack the cement paste, but simply neutralizes the alkalis present in the pore solution, forming mainly calcium carbonate which coats the pores.
Once carbonation has started, a front (dc) begins to develop, which advances towards the interior of the concrete. The mechanism of transport or movement of carbonation within the concrete is explained by diffusion theory, and is described by Fick's first law, according to the following equation (Broomfield, 2023):
| (3) |
The advance of the front (dc) depends on the square root of the time (t) to which the concrete is exposed, the carbonation rate (kc) which depends on the effective diffusivity of CO2 through the concrete, and the concentration of this gas in the exposure environment. This advance is simple to detect and measure using phenolphthalein solution dissolved in ethyl alcohol as pH indicator (UNE 112-011, 2011). Phenolphthalein turns red-purple for pH values > 9.5 (non-carbonated concrete) and becomes colorless for pH values < 8 (carbonated concrete). For intermediate values, it turns pale pink.
3. EXPERIMENTAL METHODOLOGY
The qualitative evaluation of the carbonate front was carried out on a group of 12 samples. Each sample consisted of three specimens, which were kept for approximately six years in a particular environmental exposure condition. This condition involved subjecting the specimens to alternating cycles of submergence, partial submergence, and air-drying (Figure 2). The time of each exposure cycle was not established as a study variable and therefore not controlled, but it was the same for each sample. It should be noted that the water level in the containers containing the samples was renewed approximately every two months.
Figure 2. Exposure condition of the specimens to be evaluated.
Specimens of 100 mm diameter by 200 mm height were used (IRAM 1534, 2004). The materials reported in the preparation of the samples were pozzolanic Portland cement (CPP-40) and fillerized Portland cement (CPF-40), both complying with the respective standard (IRAM 50000, 2000); rolled natural aggregates of maximum size 19 mm; and inorganic waterproofing additive identified in its technical sheet as a water-repellent additive, incorporated to the fresh mix in a dose corresponding to 10% of the mixing water. This additive presents a suspension of colloidal silicates in a viscous liquid aqueous emulsion, pale yellow in color, which is distributed within the cementitious matrix, blocking its capillaries and thus obtaining the waterproofing effect. On the other hand, these silicates react with the portlandite released by the cement, forming insoluble compounds that also block pores and capillaries.
As for the bar embedded in the upper face of the specimens (Figure 3), it corresponded to an 8 mm diameter rod, steel ADN 420 (IRAM/IAS U 500-528, 2022), and with a depth embedded in the concrete of approximately 100 mm.
Figure 3. Bar embedded in the upper face of the specimens.
Table 1 shows the references and materials used in each of the samples evaluated.
Table 1. Designation of study samples. Proportion of materials in parts.
| Desig. | w/c | Type of cement | Tipe of additive | Cement [kg/m3] |
Water [lts/m3] |
Sand [kg/m3] |
Gravel [kg/m3] |
Additive [lts/m3] |
| P-05 | 0.5 | CPP-40 (P) Pozzolanic | - | 362 | 181 | 725 | 1086 | - |
| P-06 | 0.6 | 349 | 209 | 698 | 1047 | - | ||
| P-07 | 0.7 | 337 | 236 | 675 | 1012 | - | ||
| P-05-H | 0.5 | water-repellent (H) | 362 | 163 | 725 | 1086 | 18.1 | |
| P-06-H | 0.6 | 349 | 189 | 698 | 1047 | 20.9 | ||
| P-07-H | 0.7 | 337 | 213 | 675 | 1012 | 23.6 | ||
| F-05 | 0.5 | CPF-40 (F) Fillerized | - | 362 | 181 | 725 | 1086 | - |
| F-06 | 0.6 | 349 | 209 | 698 | 1047 | - | ||
| F-07 | 0.7 | 337 | 236 | 675 | 1012 | - | ||
| F-05-H | 0.5 | water-repellent (H) | 362 | 163 | 725 | 1086 | 18.1 | |
| F-06-H | 0.6 | 349 | 189 | 698 | 1047 | 20.9 | ||
| F-07-H | 0.7 | 337 | 213 | 675 | 1012 | 23.6 |
4. EXPERIMENTAL RESULTS
For the evaluation of the carbonate front, the specimens were previously subjected to the diametral compression tensile test (IRAM 1658, 1995) (Figure 4). This made it possible to obtain two halves, and thus, two internal surfaces for evaluation. Although the specimens had an embedded bar, the breaking strain was inferred from this test.
Figure 4. Left) Diametral compression tensile test. Right) Halves obtained from the test.
A phenolphthalein solution was applied on each internal surface obtained, thus allowing to evaluate the progress of the carbonation front. Figure 5 shows the internal surfaces of one of the samples before and after the carbonation test.
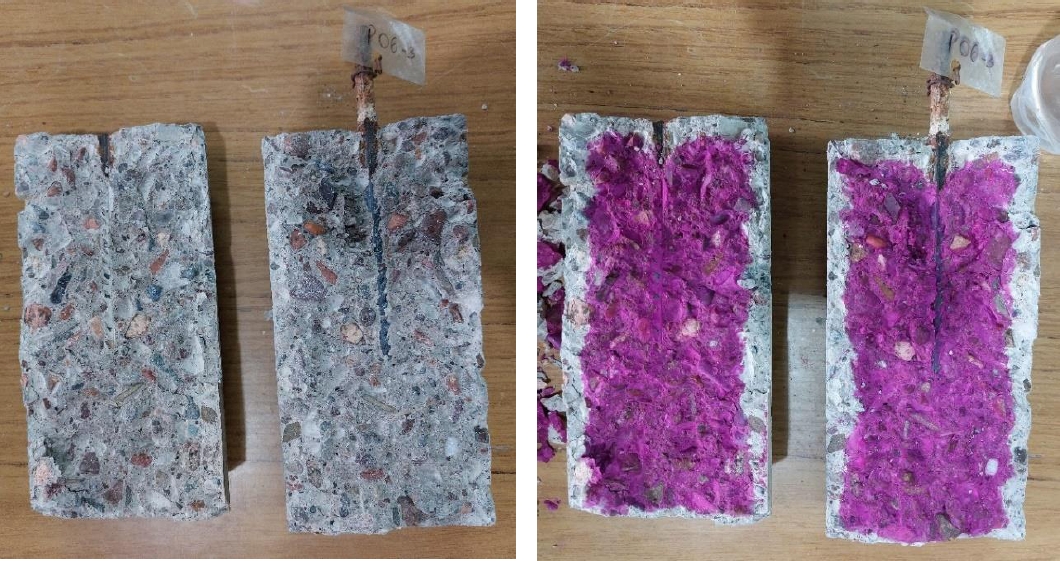
Figure 5. Left) Internal surfaces before the test. Right) After the test.
As expected, part of the reinforcement embedded in the specimen was depassivated due to the advance of the carbonation front. In addition, the exposure conditions to which the specimens were exposed over 6 years led to the initiation and subsequent propagation of the corrosive process in the depassivated section of the bar. Figure 6 shows one of the cases evaluated, where the penetration reached by the carbonated front is observed, and with it, the clear delimitation between the corroded and non-corroded bar section.
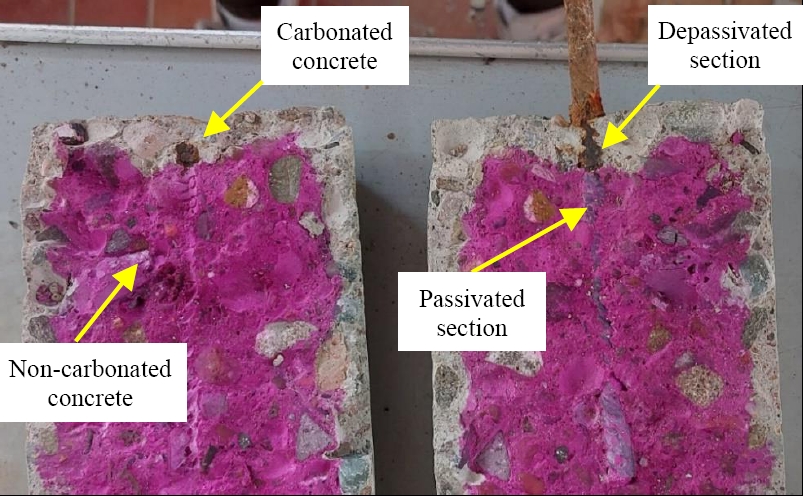
Figure 6. Advance of the carbonation front. Passivated and depassivated bar section.
The exposure conditions to which the specimens were subjected over time caused different zones of the specimens to be under different microenvironments. While the lower face was submerged most of the time, the upper face was exposed to the open air most of the time. Therefore, the lower face was the one that presented longer cycles of saturated pores, unlike what happened with the upper face. These particular conditions, it is understood, caused the advance of the carbonate front on the lower face to develop at a slower rate. This was due to the greater difficulty of CO2 dissolution in the saturated pore solution in this zone of the specimens. On the contrary, this penetration rate was higher on the upper face because this zone presented the longest cycles in dry or partially saturated pore conditions. Figure 7 shows the differences observed in the advance of the carbonation front between the lower and upper faces, for the specimens made with pozzolanic cement (P) and with fillerized cement (F), and without water-repellent additive.
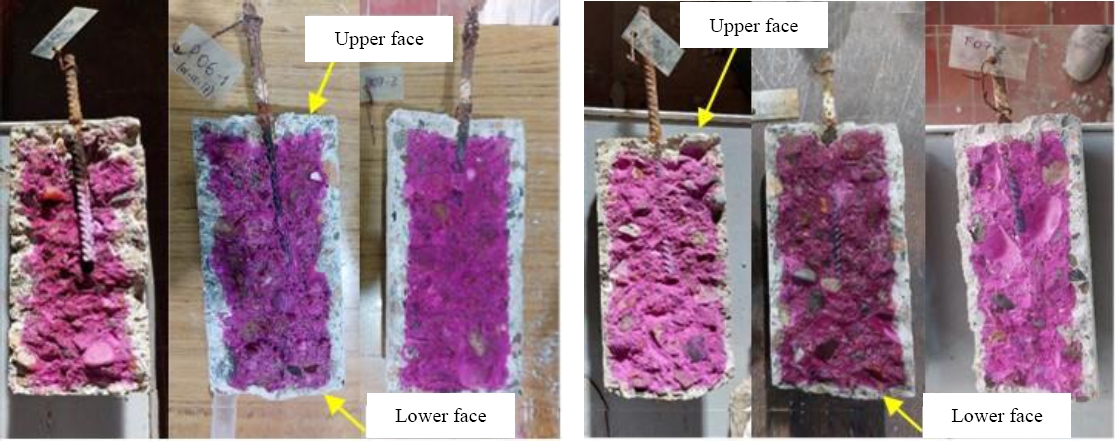
Figure 7. Advance of the carbonate front. Left) Samples “P-0x”. Right) Samples “F-0x”.
Table 2 shows the results corresponding to the diametral compressive tensile stress (ft), indicating the values determined for each of the three specimens that are part of each study sample. The average result obtained for each specimen, as well as the standard deviation Sn and the coefficient of variation C.V. are also shown.
Table 2. Tensile stress rupture.
| Designation | ft1 [MPa] |
ft2 [MPa] |
ft3 [MPa] |
ft average [MPa] |
Sn [MPa] |
C.V. [%] |
| P-05 | 2.76 | 2.95 | 2.87 | 2.86 | 0.08 | 2.7 |
| P-06 | 2.65 | 2.59 | 2.76 | 2.67 | 0.07 | 2.6 |
| P-07 | 2.61 | 2.68 | 2.72 | 2.67 | 0.05 | 1.7 |
| P-05-H | 3.81 | 3.51 | 3.67 | 3.66 | 0.12 | 3.3 |
| P-06-H | 2.59 | 2.42 | 2.51 | 2.51 | 0.07 | 2.8 |
| P-07-H | 1.77 | 1.96 | 1.90 | 1.88 | 0.08 | 4.2 |
| F-05 | 3.42 | 3.57 | 3.32 | 3.44 | 0.10 | 3.0 |
| F-06 | 2.76 | 2.66 | 2.97 | 2.80 | 0.13 | 4.6 |
| F-07 | 2.62 | 2.53 | 2.56 | 2.57 | 0.04 | 1.5 |
| F-05-H | 3.33 | 3.41 | 3.59 | 3.44 | 0.11 | 3.2 |
| F-06-H | 2.47 | 2.41 | 2.29 | 2.39 | 0.07 | 3.1 |
| F-07-H | 2.27 | 2.28 | 2.33 | 2.29 | 0.03 | 1.1 |
Tables 3 and 4, with the same statistical analysis as Table 2, show the results obtained for the depth of advance of the carbonate front (dc), both for the lower face of the specimens and for their upper face.
Table 3. Carbonated front on the lower face for an exposure time of 6 years.
| Designation | Carbonated front on the lower face | Sn [MPa] |
C.V. [%] |
|||
| dc1 [mm] |
dc2 [mm] |
dc3 [mm] |
dc average [mm] |
|||
| P-05 | 9.7 | 8.1 | 9.3 | 9.0 | 0.7 | 7.5 |
| P-06 | 9.5 | 11.8 | 9.0 | 10.1 | 1.2 | 12.1 |
| P-07 | 11.6 | 11.6 | 9.7 | 11.0 | 0.9 | 8.2 |
| P-05-H | 10.4 | 11.6 | 11.2 | 11.1 | 0.5 | 4.5 |
| P-06-H | 12.0 | 14.5 | 12.5 | 13.0 | 1.1 | 8.3 |
| P-07-H | 16.8 | 13.3 | 14.5 | 14.9 | 1.5 | 9.8 |
| F-05 | 7.2 | 6.0 | 8.4 | 7.2 | 1.0 | 13.6 |
| F-06 | 8.2 | 11.0 | 8.0 | 9.1 | 1.4 | 15.1 |
| F-07 | 8.7 | 10.1 | 8.5 | 9.1 | 0.7 | 7.8 |
| F-05-H | 8.9 | 6.5 | 6.3 | 7.2 | 1.2 | 16.3 |
| F-06-H | 8.0 | 9.5 | 9.7 | 9.1 | 0.8 | 8.4 |
| F-07-H | 10.7 | 9.9 | 9.6 | 10.1 | 0.5 | 4.6 |
Table 4. Carbonated front on the upper face for an exposure time of 6 years.
| Designation | Carbonated front on the upper face | Sn [MPa] |
C.V. [%] |
|||
| dc1 [mm] |
dc2 [mm] |
dc3 [mm] |
dc average [mm] |
|||
| P-05 | 13.3 | 12.1 | 13.2 | 12.9 | 0.5 | 4.2 |
| P-06 | 13.8 | 14.3 | 11.3 | 13.1 | 1.3 | 10.0 |
| P-07 | 19.5 | 17.3 | 17.2 | 18.0 | 1.1 | 5.9 |
| P-05-H | 15.7 | 18.8 | 15.9 | 16.8 | 1.4 | 8.4 |
| P-06-H | 15.0 | 17.8 | 15.1 | 16.0 | 1.3 | 8.1 |
| P-07-H | 26.3 | 24.2 | 24.2 | 24,9 | 1.0 | 4.0 |
| F-05 | 10.4 | 10.2 | 12.8 | 11.1 | 1.2 | 10.6 |
| F-06 | 11.9 | 13.4 | 10.6 | 12.0 | 1.1 | 9.6 |
| F-07 | 12.1 | 14.9 | 14.7 | 13.9 | 1.3 | 9.2 |
| F-05-H | 12.2 | 11.1 | 10.1 | 11.1 | 0.9 | 7.7 |
| F-06-H | 10.6 | 11.5 | 11.3 | 11.1 | 0.4 | 3.5 |
| F-07-H | 14.8 | 14.6 | 12.7 | 14.0 | 1.0 | 6.7 |
Finally, Table 5 shows the determination of the carbonation velocity (kc) obtained from equation (1), taking into account the results of the front advance indicated in Tables 3 and 4, and the exposure time (t) of 6 years to which the samples were subjected from their preparation until the time of the measurements carried out.
Table 5. Average carbonation rate for an exposure time of 6 years.
| Designation | kc average [mm/año0.5] | |
| Lower face | Upper face | |
| P-05 | 3.7 | 5.3 |
| P-06 | 4.1 | 5.3 |
| P-07 | 4.5 | 7.3 |
| P-05-H | 4.5 | 6.9 |
| P-06-H | 5.3 | 6.5 |
| P-07-H | 6.1 | 10.2 |
| F-05 | 2.9 | 4.5 |
| F-06 | 3.7 | 4.9 |
| F-07 | 3.7 | 5.7 |
| F-05-H | 2.9 | 4.5 |
| F-06-H | 3.7 | 4.5 |
| F-07-H | 4.1 | 6.1 |
Figure 8 shows, for each of the study samples, the evolution of the carbonate front advance as a function of the tensile strength (ft). It is observed that the higher the strength values obtained in the tests, the lower the advance of the carbonate front (dc).
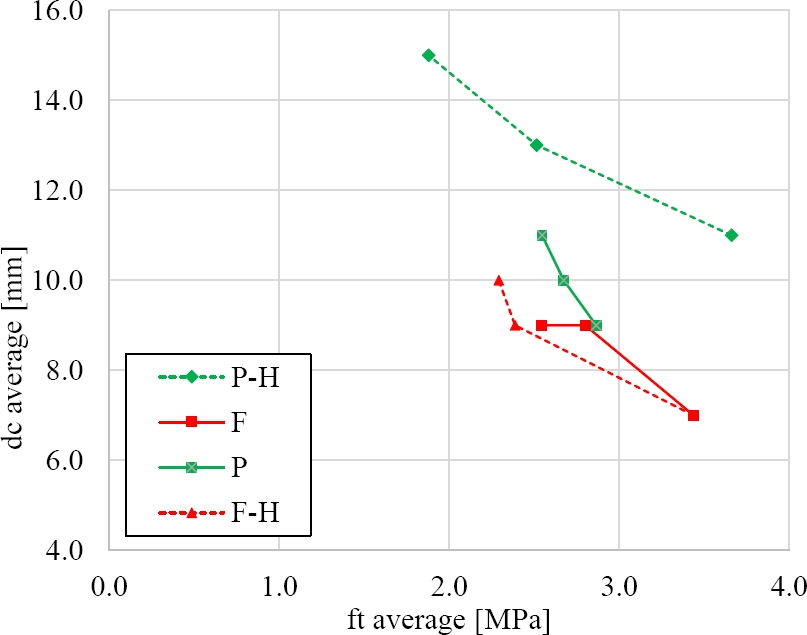
Figure 8. Tensile rupture stress vs. carbonate front advancement on lower face.
For similar levels of tensile breaking strain, the carbonate front breakthrough was higher in those samples made with pozzolanic cement. This could be due to the lower alkaline reserve available due to the consumption of portlandite resulting from the pozzolanic reaction (de Medeiros et al., 2017). Regarding the effect of the hydrophobic additive, the incorporation of the additive resulted in a slight increase of the carbonate front. In this case, it could correspond to the fact that such additives are hydrophobic materials based on salts of fatty acids, calcium, ammonium, etc., which react with portlandite (Ramachandran, 1996), again decreasing the alkaline reserve.
5. APPLICATION OF CIRSOC 201 TO THE CASE STUDIES
Based on the above, the example of a reinforced concrete element that is part of a foundation structure, with environmental exposure class A2 corresponding to carbonation corrosion (CIRSOC 201, 2005), is considered as an example. This element has rebars with a diameter of less than 16 mm and is in vertical contact with the ground. In this case, the minimum concrete cover required would be 30 mm. From the carbonation velocities kc determined in Table 5, the times that should elapse from the commissioning of the concrete until the carbonation reaches the location of the rebars could be obtained. On the other hand, Table 6 presents the values of these times inferred through the predictive model (equation 1) applied to the study specimens.
Table 6. Time t in years for the start of eventual corrosion propagation.
| Designation | Time t for dc = 30 mm | |
| Lower face | Upper face | |
| P-05 | 67 | 32 |
| P-06 | 54 | 32 |
| P-07 | 45 | 17 |
| P-05-H | 45 | 19 |
| P-06-H | 32 | 21 |
| P-07-H | 24 | 9 |
| F-05 | 110 | 45 |
| F-06 | 67 | 38 |
| F-07 | 67 | 28 |
| F-05-H | 110 | 45 |
| F-06-H | 67 | 45 |
| F-07-H | 54 | 24 |
The time elapsed from the commissioning of the concrete until the carbonate front reaches the location of the reinforcement is known as the initiation period. From this time onwards, the period defined as propagation begins, a period in which the corrosion of the reinforcement develops (Tuutti, 1982). On the other hand, the service life of a structure is defined as a point in time at which it is no longer able to meet essential requirements such as safety, functionality and aesthetic appearance. This service life is constituted by the initiation time period and part or all of the propagation time period.
In this sense, the CIRSOC 201 Regulation (CIRSOC 201, 2005) establishes a service life of 50 years. Therefore, from the results shown in Table 6 and with respect to the lower face of the specimens, it is observed that only two samples, P-06-H and P-07-H, had t-times well below the specified service life. Meanwhile, for the upper face, except for samples F-05, F-05-H and F-06-H, the rest again presented a t-time significantly below the predicted useful life.
Assuming then a service condition for the concretes evaluated under the wetting-drying exposure environment and with overlay requirements of 30 mm. In this case, it would result in general and without differentiating the behavior between faces, that the samples with w/c ratios not greater than 0.5 and with fillerized cement, the service life would be in the order of what is established by the regulation. While differentiating the behavior between faces, for the particular condition of a face mostly saturated over time, w/c ratios not higher than 0.6 could comply with the service life, except for the case P-06-H.
Finally, the above mentioned in this qualitative study shows the difference in behavior observed for the carbonate front, depending, among other possible causes, on the condition of exposure over time to which the faces of the samples were particularly subjected, even though in general it was a wetting-drying condition.
If these results are validated in future research, this could lead to a recommendation for the regulations currently in force in Argentina. Therefore, whenever it is foreseen that the concrete in service will be under the saturated condition, or under the outdoor exposure condition, a differentiation in the definition of the environmental exposure classes could be considered. This particular situation has also been defined by other authors as microenvironments. Currently, these environmental conditions, saturation-free air, are represented in the regulations (CIRSOC 201, 2005) in a general way, under the same exposure class.
6. CONCLUSIONS
From the study carried out and the qualitative interpretation of the trends observed in the results, the following conclusions obtained for the study samples are presented:
• The higher the diametral compressive tensile strength of the concrete, the lower the advance of the carbonate front turned out to be. This behavior is in total agreement with the w/c ratio.
• For similar strength levels, the advancement of the front was greater in samples made with pozzolanic cement with respect to samples made with fillerized cement.
• The incorporation of the water-repellent additive resulted in an increase in the carbonate front advance.
• During the 6 years of exposure of the samples, the advance was deeper in the faces mostly exposed to the open air than in the faces mostly saturated.
5. ACKNOWLEDGMENTS
To the Secretaría de Ciencia y Técnica, Universidad Tecnológica Nacional, for the financing of Project PID 8573.
8. REFERENCES
Behnood, A., Van Tittelboom, K., De Belie, N. (2016), Methods for measuring pH in concrete: A review”. Construction and Building Materials, 105, 176-188. https://doi.org/10.1016/j.conbuildmat.2015.12.032
Broomfield, J. P. (2023), Corrosion of steel in concrete: understanding, investigation and repair. Crc Press. https://doi.org/10.1201/9781003223016
Castro, P., Sanjúan, M., Genescá, J. (2000), Carbonation of concretes in the Mexican Gulf. Building and Environment 35, 145-149. https://doi.org/10.1016/S0360-1323(99)00009-8
CIRSOC 201 (2005), Reglamento Argentino de Estructuras de Hormigón. INTI, Argentina. https://www.inti.gob.ar/assets/uploads/files/cirsoc/vigencia-013/area100/area100a/reglamento201completo.pdf
Dal Molin, D. (1988), “Fissuras en estructuras de concreto armado: Análisis das manisfetacoes típicas e levantamento de casos ocorridos no Estado do Rio Grande do Sul”, Universidad Federal de Rio Grande do Sul, Porto Alegre, Brasil.
De Medeiros, M., Raisdorfer, J., Hoppe Filho, J., Medeiros-Junior, R. (2017). Partial replacement and addition of fly ash in Portland cement: influences on carbonation and alkaline reserve. Journal of Building Pathology and Rehabilitation, 2, 1-9. https://doi.org/10.1007/s41024-017-0023-z
Di Maio, A., Sota, J., Traversa, L. (1999), “Patología de estructuras de hormigón. Análisis de algunos casos más relevantes ocurridos en la Argentina en los últimos años”, III Congreso Iberoamericano de Patología de la Construcción y V Congreso Iberoamericano de Control de Calidad, La Habana, Cuba.
Guzmán, M., Maldonado, G., Giolo, E. (2018), Evaluación de la resistividad eléctrica del hormigón como parámetro de durabilidad frente a la corrosión del acero, XXXVIII Jornadas Sudamericanas de Ingeniería Estructural, Lima, Perú.
Guzmán, M., Maldonado, G., Roldan, V., Acosta, S., Dagne, C. (2019), END para la valoración cualitativa del proceso corrosivo en probetas de hormigón armado con distintas características de diseño, XII Congreso Regional de Ensayos No Destructivos y Estructurales CORENDE, Buenos Aires, Argentina.
Guzmán, A. (2023), Umbrales de resistividad para evaluar durabilidad del hormigón con hidrofugantes y diferentes relaciones agua/cemento. Revista ALCONPAT, 13(3), 286-298. https://doi.org/10.21041/ra.v13i3.699
Houst, Y., Wittmann, F. (2002), Depth profiles of carbonates formed during natural carbonation. Cement and Concrete Research 32, 1923-1930. https://doi.org/10.1016/S0008-8846(02)00908-0
Instituto Argentino de Normalización y Certificación (1995), IRAM 1658: Determinación de la resistencia a la tracción simple por compresión diametral. Buenos Aires, Argentina, IRAM. https://www.iram.org.ar/
Instituto Argentino de Normalización y Certificación (2000), IRAM 50000: Cemento para uso general. Buenos Aires, Argentina, IRAM. https://www.iram.org.ar/
Instituto Argentino de Normalización y Certificación (2004), IRAM 1534: Hormigón. Preparación y curado de probetas en laboratorio para ensayos de compresión y de tracción por compresión diametral. Buenos Aires, Argentina, IRAM. https://www.iram.org.ar/
Instituto Argentino de Normalización y Certificación (2022), IRAM/IAS U 500-528: Barras de acero conformadas de dureza natural, para armadura en estructura de hormigón. Buenos Aires, Argentina, IRAM. https://www.iram.org.ar/
Irassar, E. (2001), Durabilidad del hormigón estructural, XIV Reunión Técnica de la Asociación Argentina de Tecnología del Hormigón y Seminario de Durabilidad del Hormigón Estructural, Olavarría, Buenos Aires, Argentina.
Leemann, A., Nygaard, P., Kaufmann, J., Loser, R. (2015). Relation between carbonation resistance, mix design and exposure of mortar and concrete. Cement and Concrete Composites 62, 33-43. https://doi.org/10.1016/j.cemconcomp.2015.04.020
Marcotte, T. (2001), Characterization of chloride-induced corrosion products that form in steel-reinforced cementitious materials, PhD Thesis in Mechanical Engineering, University of Waterloo, Waterloo, Canada. https://uwspace.uwaterloo.ca/bitstream/handle/10012/694/NQ65251.pdf?sequence=1
Priano, C., Señas, L. (2013), Carbonatación de estructuras de hormigón ubicadas en ambiente urbano y rural. International Journal of Innovation and Applied Studies, 2(1), 6-15. http://www.issr-journals.org/ijias/
Pu, Q., Jiang, L., Xu, J., Chu, H., Xu, Y., Zhang, Y. (2012), Evolution of pH and chemical composition of pore solution in carbonated concrete. Construction and Building Materials, 28(1), 519-524. https://doi.org/10.1016/j.conbuildmat.2011.09.006
Ramachandran, V. S. (1996). Concrete admixtures handbook: properties, science and technology. William Andrew. https://www.sciencedirect.com/book/9780815513735/concrete-admixtures-handbook
Rao, N., Meena, T. (2017). A review on carbonation study in concrete. IOP Conference Series: Materials Science and Engineering, 263(3), IOP Publishing. https://iopscience.iop.org/article/10.1088/1757-899X/263/3/032011/pdf
Trocónis, O., Romero, A., Andrade, C., Helene, P., Díaz, I. (1997), Manual de inspección, evaluación y diagnóstico de corrosión en estructuras de hormigón armado. CYTED, Red Temática XV. B. Durabilidad de la armadura, Río de Janeiro, Brasil. https://repositorio.usp.br/item/000923678
Tuutti, K. (1982), Corrosion of steel in concrete. Swedish Cement and Concrete Research Institute, Stockholm. https://lucris.lub.lu.se/ws/portalfiles/portal/4709458/3173290.pdf
UNE 112-011 (2011), Corrosión en armaduras. Determinación de la profundidad de carbonatación en hormigones endurecidos y puestos en servicio. AENOR, Asociación Española de Normalización y Certificación. https://www.une.org/encuentra-tu-norma/busca-tu-norma/norma?c=N0047865