![]()
| Study Case | https://doi.org/10.21041/ra.v14i3.752 |
Mapping building facades using panoramic images captured by Unmanned Aerial Vehicle (UAV)
Mapeo de fachadas mediante imágenes panorámicas obtenidas por Vehículo Aéreo No Tripulado (VANT)
Mapeamento de fachadas por meio de imagens panorâmicas obtidas por Veículo Aéreo Não Tripulado (VANT)
M. Bordinhão1* , B. Tamiosso1, S. Venquiaruto1, A. Temp1, F. Costa1,2
1 Grupo de Pesquisa em Tecnologia da Construção – GPTeC, Universidade Federal do Pampa, Alegrete/RS, Brasil.
2 Programa de Pós-Graduação em Engenharia – PPEng, Universidade Federal do Pampa, Alegrete/RS, Brasil.
*Contact author: mbordinhao.engcivil@gmail.com
Received: 01/06/2024
Revised: 24/08/2024
Accepted: 29/08/2024
Published: 01/09/2024
| Cite as: Bordinhão, M. Tamiosso, B., Venquiaruto, S., Temp, A., Costa, F. (2024), “Mapping building facades using panoramic images captured by Unmanned Aerial Vehicle (UAV)”, Revista ALCONPAT, 14 (3), pp. 318 - 331, DOI: https://doi.org/10.21041/ra.v14i3.752 |
ABSTRACT
This work aims to verify the building pathologies of DTIC’s building front (Diretoria de Tecnologia da Informação e Comunicação at Federal University of Pampa - Alegrete/RS, Brazil) by using an Unmanned Aerial Vehicle (UAV). The study was conducted before and six months after its maintenance. Images and inspection records were used to elaborate the Damage Maps and the Grid Method for pathologies quantifications. The comparison of the Damage Maps before and after maintenance has revealed that the intervention (paint) was not efficient, since it has disguised temporarily the anomalies without correcting them. The use of UAV proved to be a good tool for building inspections, providing effective diagnosis, time-saving and security for the operator without working at height.
Keywords: anomalies; building inspection; damage map; pathological manifestations; UAV (Unmanned Aerial Vehicle).
1. INTRODUCTION
Building construction in Brazil has seen a significant increase in problems related to facade degradation, which leads to reduced aesthetic value, watertightness issues, and decreased comfort and efficiency. Building maintenance is a well-established practice, and when performed preventively, it is essential for enhancing the durability of the structure and its components (Pereira, Silva, & Brito, 2018).
Pathologies in building facades are considered major aesthetic issues that cause discomfort to users. Furthermore, external pathologies contribute to increased maintenance and repair costs (Olivi, 2013; França, 2016). In this context, the inspection, identification, and quantification of building pathologies are necessary to prevent costly future maintenance.
Accelerations in construction processes and design may lead to failures in the design and execution phases of a building. However, advances in technology have supported new civil engineering practices, materials, and equipment, such as the use of Unmanned Aerial Vehicles (UAVs) to improve building inspections. UAVs address the challenges of physically accessing higher parts of buildings, reducing risk, and saving time, thereby contributing to the efficiency of the inspection process (Souza, 2018).
The use of UAVs for building inspections is notable for its efficiency and safety in collecting detailed data on building conditions, allowing for a thorough analysis of pathological manifestations. This is crucial for understanding the extent of damage and planning effective maintenance interventions. Employing these emerging technologies not only simplifies the inspection process but also enhances accuracy and speed in obtaining essential information for technical decision-making, thus supporting the aim of this research.
This study aims to evaluate the contribution of UAVs in facilitating the identification and quantification of pathological manifestations in buildings. The research was conducted at the DTIC building, located at the Federal University of Pampa, Alegrete/RS Campus. Through technical inspections, anomalies in the building were identified at two distinct stages: before and after six months of maintenance. Damage maps were then prepared and analyzed. Finally, the contribution of UAVs to the building mapping process was assessed.
2. LITERATURE REVIEW
2.1 Building inspection using UAVs
According to the Associação Brasileira de Normas Técnicas (ABNT) and Brazilian standard NBR 16747 (ABNT, 2020), building assessment involves analyzing the building’s condition in relation to its ability to perform functions according to user requirements. This includes recording anomalies, maintenance issues, operational failures, and pathological manifestations identified in various building components. Inspections should describe the degradation of each system, estimate performance loss whenever possible, and recommend actions to minimize corrective maintenance services, including a prognosis of future occurrences (ABNT, 2012).
Until recently, qualified professionals conducted building inspections through technical analysis of conservation, safety, and stability conditions using tools such as cameras and spreadsheets. However, with advancements in technology, innovative equipment like UAVs (Unmanned Aerial Vehicles) has emerged. UAVs aim to optimize time, enhance comfort, eliminate the need for lifting equipment and specialized operators, and improve safety during inspections (Souza, 2018).
UAVs are prominent in several civil engineering sectors, including urban infrastructure, pavement infrastructure, and structural damage assessment (Passuello, 2021). In hazardous locations requiring specialized safety equipment, UAVs can be used to monitor construction sites and map complete locations. UAVs can also remotely collect humidity data when equipped with a thermal imaging camera (Wasaki, 2022).
2.2 Damage Map
According to Gaspar and Brito (2013), a damage map is a graphical document that summarizes information about observed damage to the object under study. This document should cover all pathological manifestations identified in the building's structural components. Tirello and Correa (2012) and Costa (2010) describe the damage map as a detailed and rigorous photographic record of the structure, identifying each pathological manifestation through various forms of representation (symbols, color or texture stains, letter or number indices, etc.). The damage map must faithfully represent the building’s state of conservation.
Barthel, Lins, and Pestana (2009) assert that the damage map should accurately identify damage to facilitate future preventive actions (maintaining conservation status) and interventions to enhance the building's durability and usability. The damage map must be regularly updated, as diagnoses will change with the development of pathological manifestations. It is also important to note that identifying anomalies for damage maps is not trivial and depends on understanding their manifestations (Lopes, Bauer, & Silva, 2024).
For damage maps, it is recommended to plan Damage Identification Forms (DIFs). DIFs are primary database documents (printed or digital) containing records, graphics, and photographic notes on the building’s current state. These documents are crucial for producing the damage map, which should use clear and objective vocabulary. Proper attention is needed to accurately convey the building’s conservation status (Tinoco, 2009).
2.3 Building pathology quantification
Silva (2014) recommends the Grid Method for quantifying pathological manifestations in buildings. In the study, various grid dimensions were tested for damage map preparation (1.60 x 1.60 m, 1.00 x 1.00 m, and 0.70 x 0.70 m). The author found that further refinement in grid resolution was necessary, ultimately settling on a dimension of 0.50 m x 0.50 m. According to Silva (2014), each grid unit represents an area of damage, and to convert these damage units into square meters, they must be multiplied by the area of a grid unit. This area-based damage count is then used to calculate the Damage Factor (DF). The method involves overlaying a 0.50 m x 0.50 m grid (Figure 1) on the damage map of each building facade. Each grid unit corresponds to 0.25 m² of area. The Damage Factor index can then be applied - Equation 1. The DF assesses the extent of damage based on the total facade area and serves as an initial analysis parameter for diagnosing the percentage of the total degraded area.
| (1) |
Where,
FD: Damage Factor of the total building facade (%);
Ad: Damage area (n), calculated in the mapping process (m²);
At: Total area of the facade (m²).
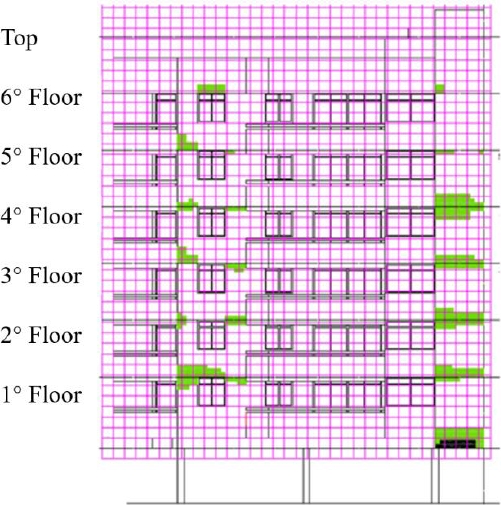
Figure 1. Mesh overlay for quantification of building pathological manifestations.
According to Silva (2014), the Damage Factor can be calculated for both specific damaged areas (i.e., particular pathological manifestations) and the total damaged area, which includes all types of damage. The author emphasizes that the total damaged area can, theoretically, exceed the area of the facade sample, as more than one type of pathological manifestation may occur within the same grid unit, with each unit being quantified separately.
3. METHODOLOGY
This study was divided into four (4) steps: Step 1 - the visit to the building; Step 2 - data collection; Step 3 - data treatment and Step 4 - analysis of the results. Figure 2 shows a detailed explanation of each step of the research.
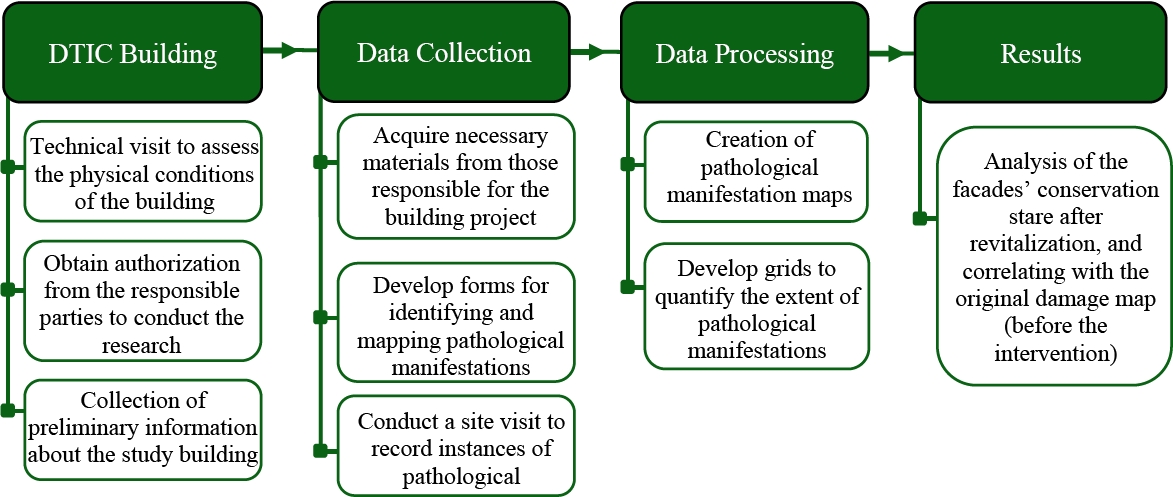
Figure 2. Research steps.
3.1 Building characteristics
The building analyzed is a federal asset of UNIPAMPA Campus Alegrete (Figure 3), which is called DTIC (Diretoria de Tecnologia da Informação e Comunicação). The construction of the building was completed in 2015 and it works as a department of Rectorate. The building has two (2) floors and a total area of 1346 m². It was made with reinforced concrete and ceramic bricks. The facades are covered with mortar coating and finished with acrylic paint (external and internal).
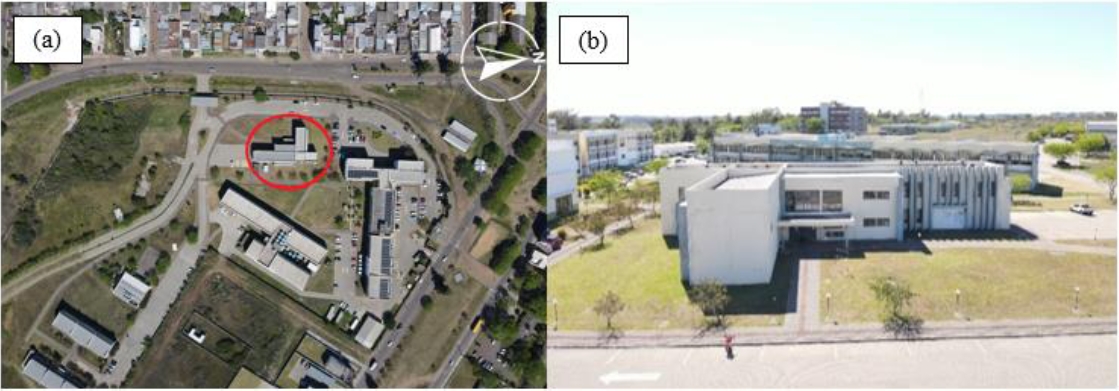
Figure 3. DTIC building location at UNIPAMPA Campus Alegrete (a) and access facade to the DTIC building (b).
The building underwent a facade maintenance in 2022, in which all the facades were painted. It should be noted that no repairs were made to the existing pathological manifestations and the facades were not cleaned, which is recommended for the success of the intervention.
3.2 Data collect
The UAV applied to visualize the damage in the facades was the DJI Mavic 2 Enterprise Advanced, equipped with a radiometric thermographic camera with a thermal resolution of 640 x 512 pixels, and a visual camera with a resolution of 48 megapixels, ½″ CMOS sensor and 32x digital zoom. The visual inspection consisted of two distinct stages, i.e., before the facades intervention (painting) and after six (6) months of its execution. The objective of the two inspections was to verify whether the pathological manifestations would appear in a short period since the causes of these were not being treated during the maintenance of the building (painting).
On November 17, 2022, the first visual inspection and photographic records by UAV were carried out as shown in Figure 4, in order to verify the anomalies presented in the building. The lateral distance of the drone in relation to the building was kept at approximately 2.5 meters. A distance of about 1.5 meters was fixed to capture relevant details at close range, maintaining a safety margin. In addition, distances of 10 to 30 meters were used to capture the whole structure. The mapping was carried out starting from the highest point of the building towards the base, with an approximate flight time of 40 minutes. It is important to emphasize that local regulations and environmental conditions must be considered when planning UAV mapping.
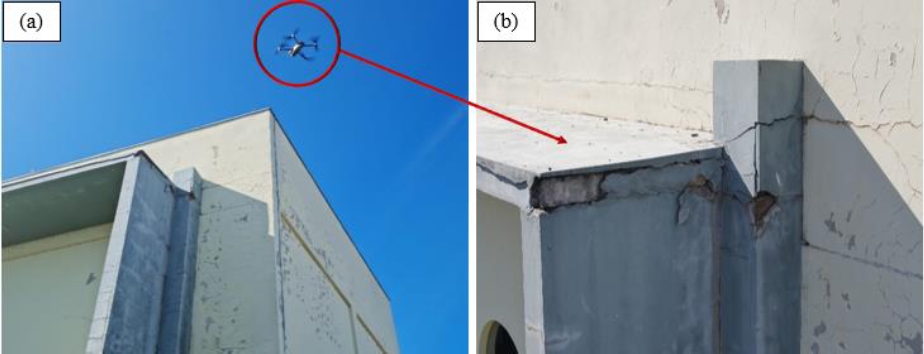
Figure 4. North facade: flight detail (a) and image capture with UAV (b).
3.3 Data treatment
After the data collection, the study of the external facades was carried out. Damage maps were prepared from the photographic survey, inspection records and available plans. The damage observed in the inspections before and after the intervention (painting) was marked using a digital drawing tool (AutoCAD).
The Grid Method (Figure 1) was used to quantify the building's pathological manifestations in the facades. The procedure was made before and after the painting maintenance. For the grid, mesh units of 0.50 m x 0.50 m were used as recommended by Silva (2014). The area quantification was then obtained by applying Equation 1. For each facade, the mesh units corresponding to each mapped pathological manifestation were counted. The number of mesh units covered by a given anomaly, multiplied by the area of each mesh unit (0.25 m2) has provided the degraded areas. As previously reported, the process of grating and quantification of damage per facade was carried out twice, i.e., before the intervention and six (6) months after the intervention (painting).
4. RESULTS AND DISCUSSION
This section shows the building's pathological manifestations mapped and quantified in the west facade using the UAV. An analysis and discussion of the results obtained are also presented.
4.1 West facade - before maintenance
Damage mapping was performed by UAV with the aid of FIDs. In this process, pathological manifestations and their locations were identified. Subsequently, the damage map of the study facade was prepared (Figure 5).
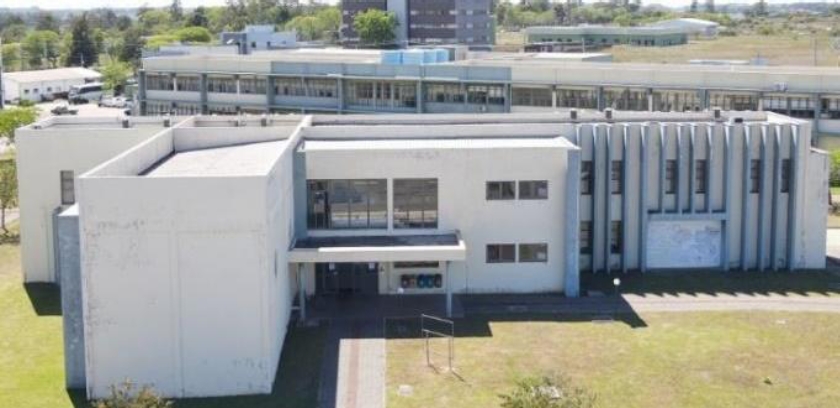
Figure 5. West facade before painting.
The grid as shown in Figure 6 was positioned over the damage map for greater precision in the damage quantification. The grid was composed by one thousand seven hundred and seventeen (1717) mesh units with an area of 0.25 m². The grid superimposed on the facade has a total area of 429.25 m². This allowed the quantification of the anomalies.
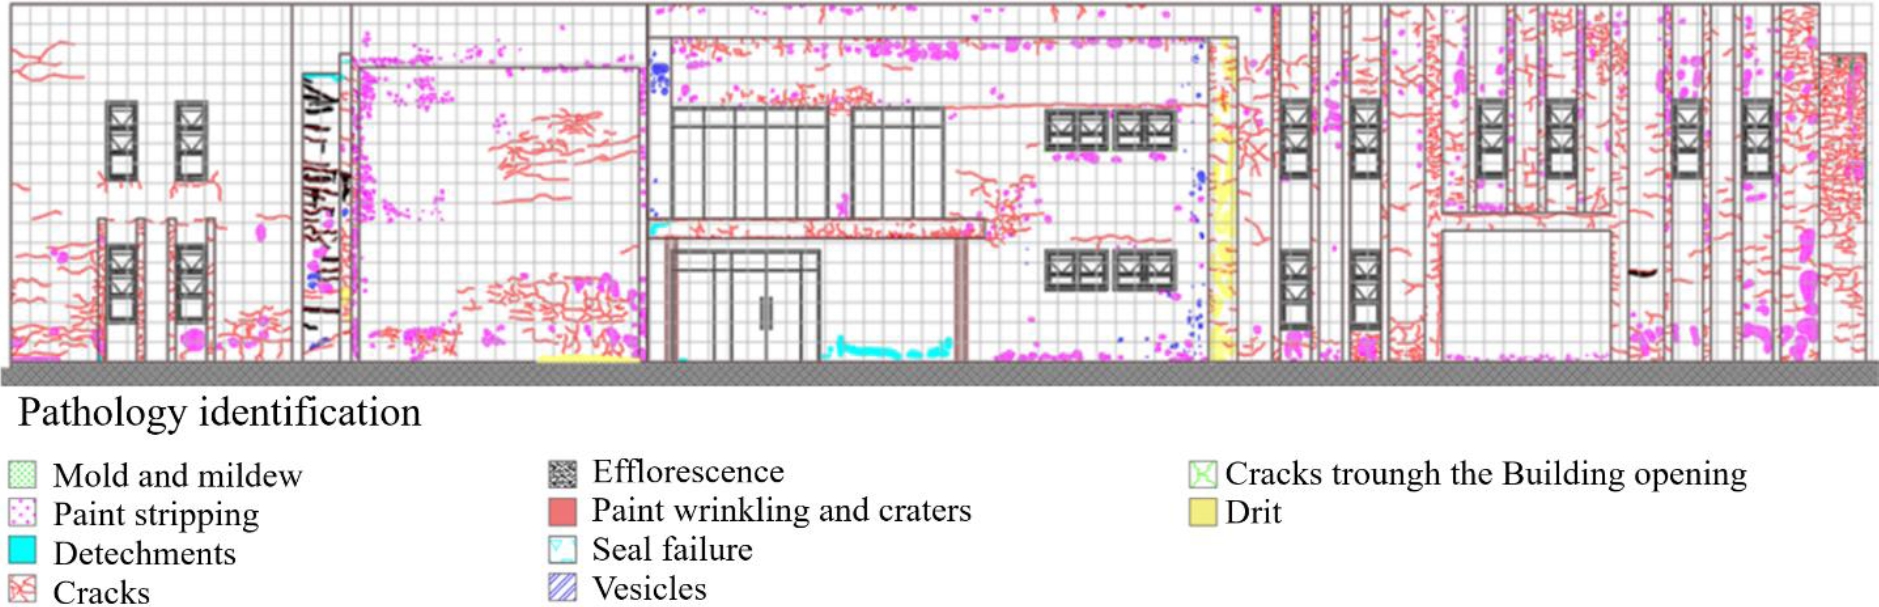
Figure 6. Damage map of the west facade with overlay grid before painting.
Table 1 shows the results based on the quantification of each pathological manifestation illustrated on Figure 7. It is worth noting that each pathological manifestation was analyzed “separately” in relation to the total area of the facade. Then, it is possible that the same mesh unit may have the presence of more than one pathological manifestation. Therefore, the sum of the pathological manifestations present on the facade may theoretically be greater than the total area of the facade.
Table 1. Pathological manifestations on the west facade before painting
| Facade: West | Facade area: 429.25 m² | ||
| Pathological manifestation | Mesh units | Percentage | Damage area (m²) |
| Crack | 683 | 40% | 170.75 |
| Paint stripping | 369 | 21% | 92.25 |
| Vesicles | 46 | 3% | 11.50 |
| Efflorescence | 27 | 2% | 6.75 |
| Dirt | 26 | 2% | 6.50 |
| Detachments | 17 | 1% | 4.25 |
| Mold and mildew | 14 | 1% | 3.50 |
| Total of damages | 7 | 70% | 295.50 m2 |
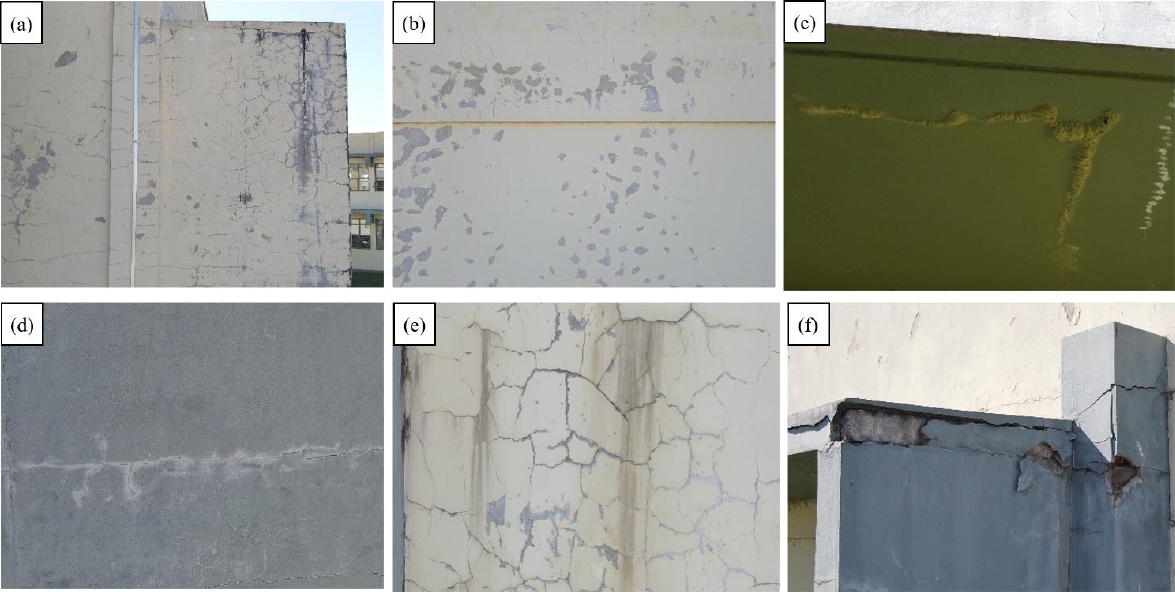
Figure 7. Pathological manifestations on the west facade six months before revitalization: crack and Mold and mildew (a), Paint stripping (b), Vesicles (c), Efflorescence, Dirt (d) and Detachments (e).
From Table 1, it can be seen that crack is presented in a large part of the facade, with an incidence of 40% in relation to the total area inspected. Painting stripping is the second one pathological manifestation most prevalent, representing 21% of the total facade area. Detachments, efflorescence, mold and mildew, vesicles and dirt corresponded to only 9% of the total area of the west facade. Cracks through the building openings, paint wrinkling and craters, and also seal failure were not identified over the west facade. According to the survey carried out and presented in Table 1, the west facade had 70% of its area (295.50 m²) compromised by pathological manifestations.
4.2 West facade - after maintenance
Figure 8 shows the conservation state of the west facade six (6) months after painting. It was possible to compare the anomalies identified before the intervention with the ones registered after the maintenance process was realized.
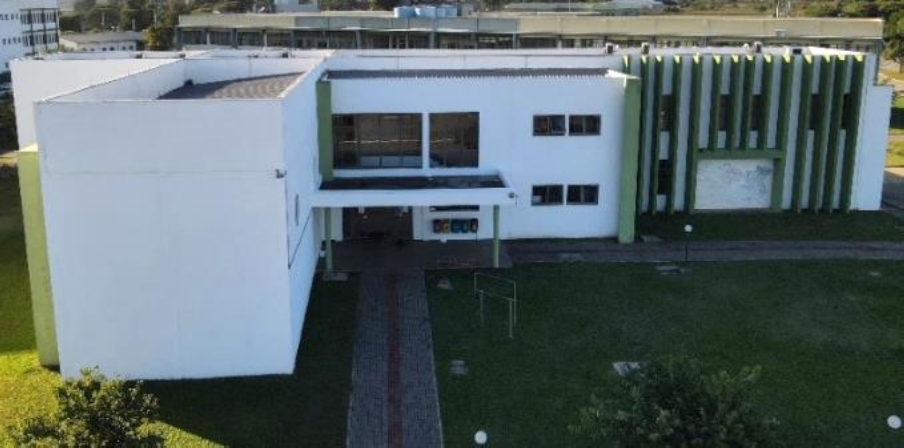
Figure 8. West facade six months after revitalization (painting).
In this second stage, the identification of the pathological manifestations was made following the same procedure applied in the facade before the intervention. Afterwards, the images using UAV, spreadsheets, and the damage map were carried out. Subsequently, the anomalies were correlated.
After revitalization, six different types of pathological manifestations were identified: cracks, dirt accumulation, detachment, efflorescence, paint stripping, and vesicles. Following UAV monitoring, anomalies were mapped using the FIDs. Subsequently, a damage map of the western area (Figure 9) was created after revitalization. An overlay grid was used for the separate quantification of these anomalies, resulting in the preparation of Table 2.
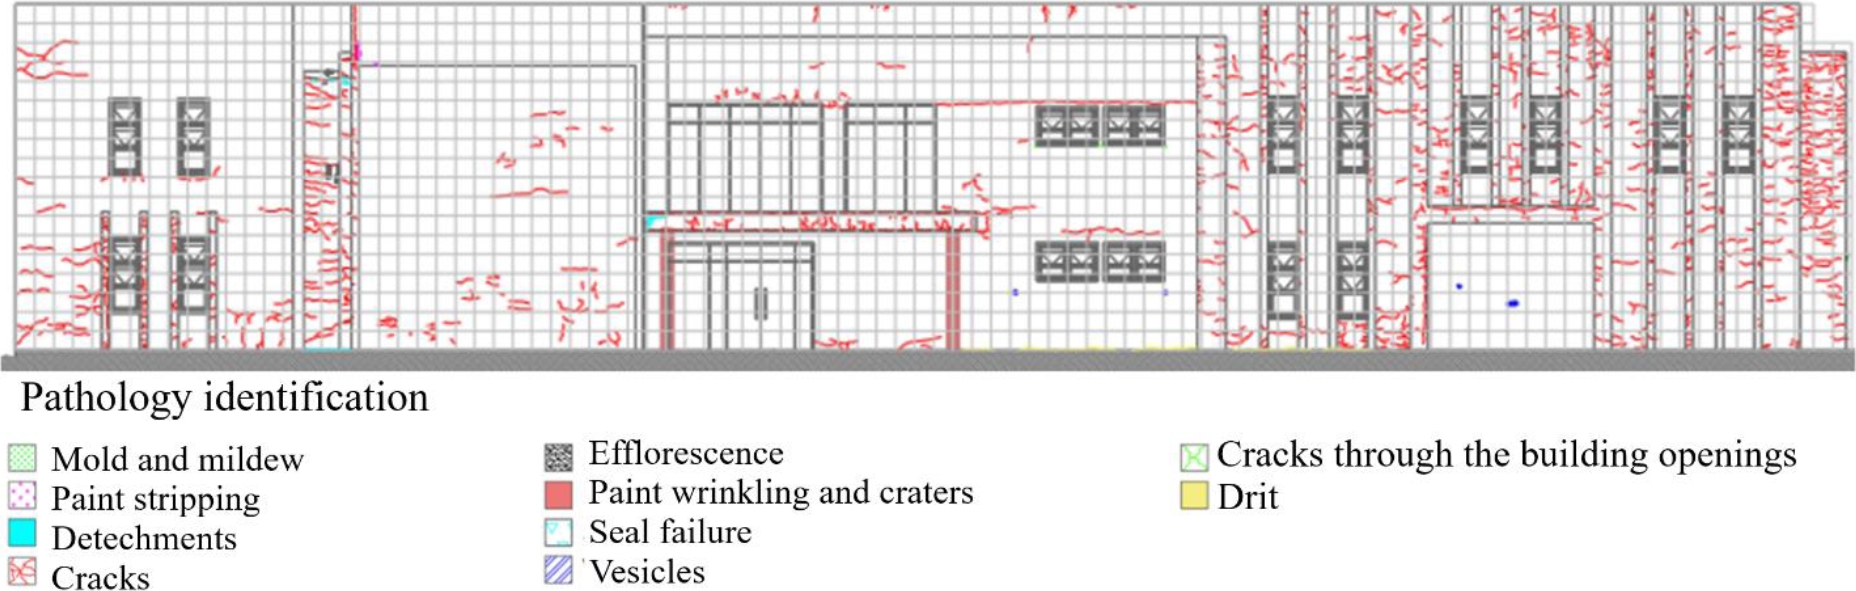
Figure 9. Damage map of the west facade with overlay grid after revitalization.
Table 2. Pathological manifestations on the west facade after painting
| Facade: West | Facade area: 429.25 m² | ||
| Pathological manifestation | Mesh units | Percentage | Damage area (m²) |
| Crack | 592 | 34% | 148.00 |
| Dirt | 17 | 1% | 4.25 |
| Detachments | 13 | 1% | 3.25 |
| Paint stripping | 4 | 0% | 1.00 |
| Vesicles | 4 | 0% | 1.00 |
| Efflorescence | 4 | 0% | 1.00 |
| Total of damages | 6 | 36% | 158.50 m2 |
According to the data in Table 2, the west facade has 158.50 m² (36%) of its area affected by pathological issues six months after its revitalization. Among the observed anomalies, cracks in the coating were the most prevalent, affecting 34% of the total facade area. Additionally, dirt and detachment issues were observed, representing 1% of the total facade area. Anomalies such as peeling, vesicles, and efflorescence were identified but were considered insignificant and therefore disregarded. There were no signs of mold and mildew, cracks around openings, wrinkling, craters, or sealing failures six months post-revitalization. Figure 10 illustrate some pathological manifestations on west facade after painting.
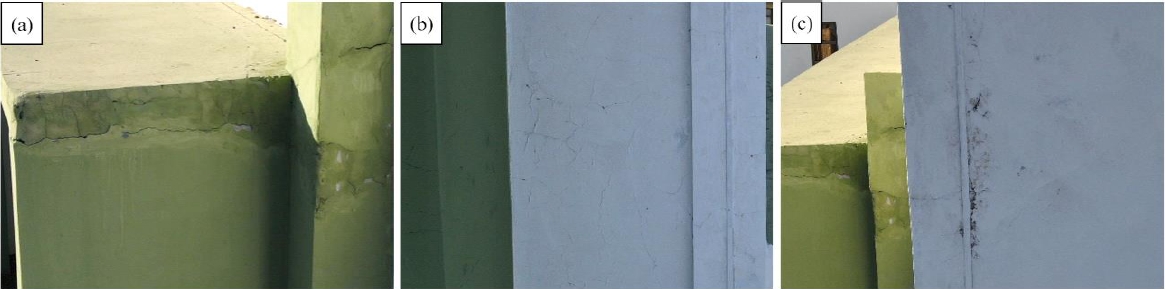
Figure 10. Pathological manifestations on the west facade six months after revitalization: crack, detachments and efflorescence (a), Vesicles and map cracking (b), Dirt and paint stripping (c).
For the analysis of pathological manifestations on the remaining facades of the DTIC building (east, north, and south facades), the same procedure outlined in sections 4.1 and 4.2 was applied. The compilation of results is presented in section 4.3.
4.3 Comparison of pathological manifestations of the facades
To facilitate a more thorough analysis of the collected data, Table 3 was created to illustrate the distribution of each group of pathological manifestations by facade. Figure 11 shows the panoramic image of each facade captured by the UAV before the maintenance (painting). This enables a more detailed examination and comparison of the data.
Table 3. Survey of anomaly percentages by facade type before revitalization.
| Facades | North | West | South | East |
| Areas with anomalies | A=256.25 m² | A= 429.25 m² | A=262.25 m² | A=43,50 m² |
| Crack | 31% | 40% | 40% | 85% |
| Detachments | 12% | 21% | 11% | 10% |
| Dirt | 1% | 2% | 15% | 6% |
| Efflorescence | 5% | 2% | 3% | 2% |
| Mold and mildew | 0% | 1% | 5% | 1% |
| Vesicles | 2% | 3% | 0% | 0% |
| Painting stripping | 1% | 1% | 1% | 1% |
| Paint wrinkling and craters | 0% | 0% | 1% | 0% |
| Seal failure | 0% | 0% | 0% | 1% |
| Nº anomalies founded | 6 | 7 | 7 | 7 |
| Areas with anomalies | 52% | 70% | 76% | 106% |
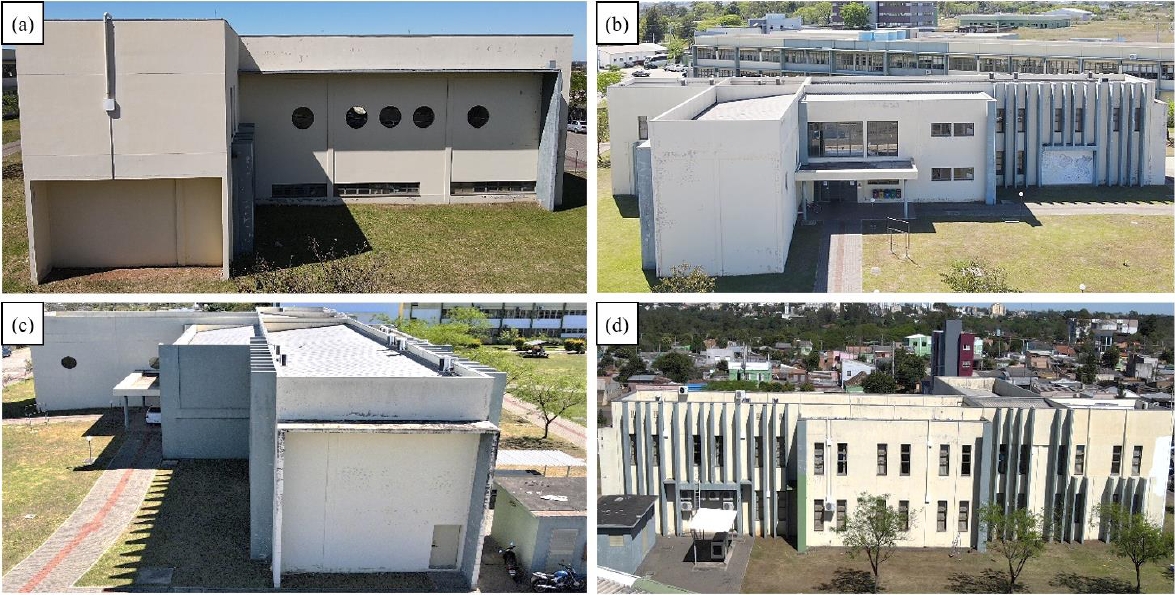
Figure 11. North facade (a), West facade (b), South facade (c), East facade (e) before revitalization
According to the information in Table 3, the west, south, and east facades each exhibited seven identified anomalies, while the north facade had six. The east, south, and west facades showed areas with anomalies covering more than 60% of their surface, whereas the north facade had the lowest coverage at 52%.
Among the facades, the east facade demonstrated the highest prevalence of anomalies. Detachments and vesicles were most prominent on the west facade, while efflorescence was slightly more common on the north facade compared to the others. The south facade showed a higher prevalence of anomalies such as mold and mildew, dirt, wrinkling, and cratering, as anticipated. Detachment occurred with the same incidence (1%) across all four analyzed facades.
The literature, including Brandelli (2019) and Silva et al. (2016), suggests that facades exposed to prolonged sunlight may experience undesirable effects. Specifically, areas most exposed to solar radiation can develop cracks due to thermal expansion and contraction caused by temperature fluctuations. In this study, despite the north facade having significant solar exposure, it exhibited the lowest incidence of cracking compared to the others. This outcome may indicate other factors influencing pathological manifestations beyond solar exposure. Chen et al. (2017) found that facades with low solar incidence tend to experience more frequent issues with dirt, mold, and mildew, a finding that aligns with the results of this study.
Table 4 presents the representative percentages of each group of pathological manifestations according to the solar orientation of each facade, six (6) months after the revitalization of the DTIC building. Finally, Figure 12 shows how the facades looked after the revitalization.
Table 4. Survey of anomaly percentages by facade type after revitalization.
| Facades | North | West | South | East |
| Area with anomalies | A=256.25 m² | A= 429.25 m² | A=262.25 m² | A=438.50 m² |
| Crack | 25% | 34% | 32% | 44% |
| Dirt | 1% | 1% | 1% | 1% |
| Mold and mildew | 0% | 0% | 2% | 1% |
| Detachments | 0% | 1% | 1% | 0% |
| Nº anomalies founded | 2 | 3 | 4 | 3 |
| Areas with anomalies | 26% | 36% | 36% | 46% |
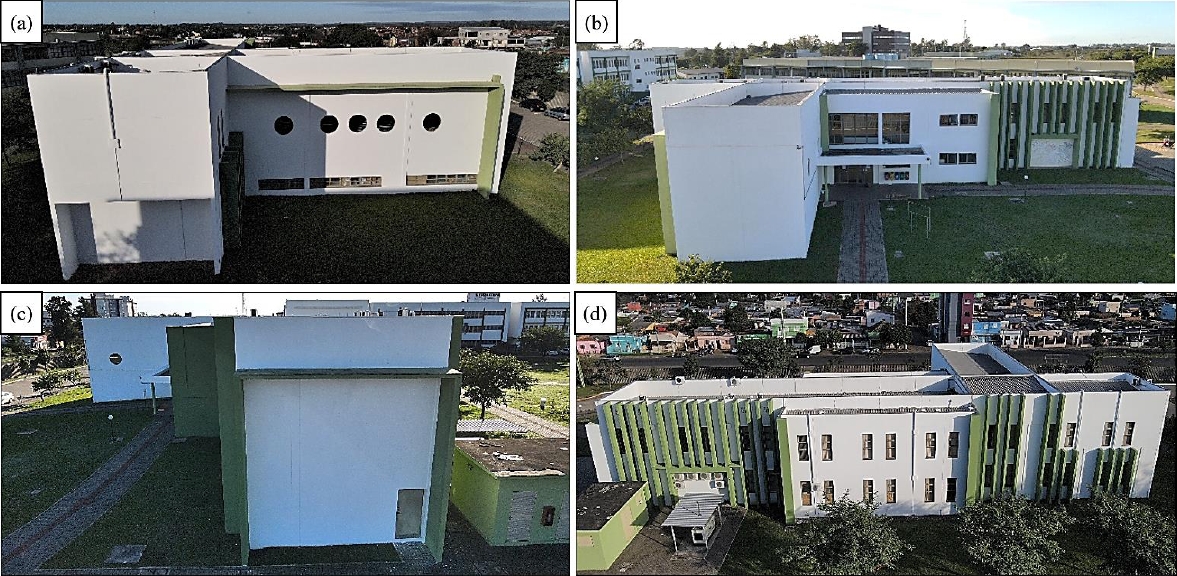
Figure 12. North facade (a), West facade (b), South facade (c), East facade (e) after revitalization.
Among the anomalies observed (Table 4) six months after the building’s revitalization, cracking is the most predominant issue, with the east facade exhibiting the largest degraded area. Dirt anomalies were uniformly distributed, showing a 1% incidence across all four analyzed facades. In contrast, mold and mildew anomalies were slightly more prevalent on the south facade (2%) compared to the east facade (1%). These anomalies were not identified on the north and west facades. Detachments were observed with the same incidence on the north and west facades (1%), while no incidence of this anomaly was recorded for the south and east facades.
Potential causes and origins of these pathological manifestations may include design errors and the use of inappropriate materials, all of which can predispose the building to premature issues. Even well-designed projects can fail if rigorous quality control is not maintained during execution. Factors such as poor application of mortar coatings, inadequate concrete curing, and unqualified labor are critical contributors to the development of cracks, paint stripping, dirt, and other pathological issues (Silva, 2008). The building's environment significantly impacts facade durability. Harsh climates, such as those with high humidity and significant temperature fluctuations, along with exposure to moisture and drying cycles, can lead to material movement and resulting damage. In buildings approximately 8 years old, pathological manifestations often reveal the initial conditions of design and execution. At this stage, observed anomalies frequently indicate premature material wear, where inferior or unsuitable materials for the specific application start to show clear signs of degradation (Souza, 2012).
5. CONCLUSION
The methodology employed in this study successfully enabled the identification and quantification of pathological manifestations in the DTIC building. The data indicated that:
East facade exhibited the highest number of issues compared to the other facades;
South facade was the second most affected, showing significant pathological manifestations;
West facade displayed a lower level of degradation compared to the east and south facades;
North facade was the least affected, showing fewer anomalies than the other inspected facades;
The condition of the building’s facades following maintenance revealed that while painting may appear to be a quick and effective solution, it is not efficient in preventing the recurrence of pathological manifestations.
Regarding the use of UAVs for capturing images of building facades, it was found to be highly effective. The UAV provided clear and efficient identification of the pathological manifestations present.
In summary, the UAV achieved its main objectives of saving time and analyzing high elevations without the need for scaffolding or other equipment that could pose risks to personnel.
6. ACKNOWLEDGEMENTS
To UNIPAMPA for supporting the development of this research.
To Prof. Dr. José Wagner Maciel Kaehler and the EIRE Group.
7. REFERENCES
Associação Brasileira De Normas Técnicas. (2012). NBR 5674: Manutenção de edificações - Requisitos para o sistema de gestão de manutenção. Rio de Janeiro.
Associação Brasileira De Normas Técnicas. (2020). NBR 16747: Inspeção predial - Diretrizes, conceitos, terminologia e procedimento. Rio de Janeiro.
Barthel, C., Lins, M., Pestana, F. (2009), O papel do mapa de danos na conservação do patrimônio arquitetônico. In: Congreso Iberoamericano, 1.; Jornada “Técnicas De Rastauración Y Conservación Del Patrimonio, 8, 2009. Anais [...]. Buenos Aires.
Brandelli, T. M. (2019), Avaliação do estado de conservação das fachadas de habitações de interesse social do PAR em Pelotas/RS: Residencial Regente, Jardins da Baronesa e Estrela Gaúcha. Dissertação (Mestrado) - Programa de pós-graduação em Arquitetura e Urbanismo, Faculdade de Arquitetura e Urbanismo, Universidade Federal de Pelotas. Pelotas.
Chen, G., Luo, Q., Guo, X., Liu, X., Tu, M., He, Y. (2017), Study on mould germination risk in hydroscopic building wall, Procedia Engineering, Volume 205, Pages 2712-2719, ISSN 1877-7058, https://doi.org/10.1016/j.proeng.2017.10.193.
Correa, R. H., Tirello, R. A. (2012), Sistema normativo para mapa de danos de edifícios históricos aplicado à Lidgerwood Manufacturing Company de Campinas. Campinas.
Costa, L. G. G. (2010), Cronidas: elaboração da base de dados para auxílio em representação de mapa de danos. Dissertação (Mestre em Arquitetura e Urbanismo) - Programa de Pós - Graduação em Arquitetura e Urbanismo da Faculdade de Arquitetura e Urbanismo, Universidade Federal da Bahia. Salvador.
Gaspar, P. L., Brito, J. De. (2013), Damage Atlas Of Cementrendered Façades. In: Freitas, V. P. De (Ed.). A State-Of-The-Art Report On Building Pathologycib - W086 Building Pathology. Porto University, Faculty of Engineering. CIB - International Council for Research and Innovation in Building and Construction, pg. 200.
Lopes, M. L. F., Bauer, E., Silva, L. S. (2024). Critérios para a identificação de anomalias em fachadas com revestimento em argamassa. Ambiente Construído, Porto Alegre, v. 24, e132144.
Olivi, G. C. (2013). Manutenção de Edifícios: uma abordagem baseada na gestão de ativos. São Paulo: Editora Pini.
Passuello, A. C. (2021), Uso de VANTs na Engenharia Civil: Panorama Acadêmico utilizando a metodologia Proknow - C. In: Congresso Internacional Sobre Patologia E Reabilitação Das Constuções, 18., 2021, Fortaleza. Anais [...]. Fortaleza.
Pereira, C., Silva, A., Brito, J. De. (2018), A Previsão Da Vida Útil De Elementos Construtivos Como Ferramenta De Apoio À Manutenção. Patorreb 2018: 6 Congreso de patología y rehabilitación de edificios: 04-06de abril de 2018, Rio de Janeiro, RJ.
Proplan (2013), Pró-Reitoria de Planejamento e Infraestrutura: órgão da administração superior da Universidade Federal do Pampa, Alegrete.
Silva, J. C. M. (2008). Patologia das Construções. 2. ed. São Paulo: Pini.
Silva, M. N. B. (2014), Avaliação quantitativa da degradação e vida útil de revestimentos de fachada - aplicação ao caso de Brasília/DF. Tese (Doutorado em Estruturas e Construção Civil) - Departamento de Engenharia Civil e Ambiental, Universidade de Brasília, Brasília.
Silva, V. M. B. Et. al. (2016), Levantamento de Manifestações Patológicas em Fachadas de Habitações de Interesse Social na Cidade de Pelotas/RS: Residencial Solar das Palmeiras. In: Revista de Arquitetura IMED, Passo Fundo, v. 5, n. 2, p. 85-103.
Souza, A. C. B. (2012). Durabilidade de Materiais e Estruturas. São Paulo: Editora Pini.
Souza, M. F. M. (2018), Panorama da autovistoria no Rio de Janeiro: Inspeção e manutenção de edificações multiresidenciais. Trabalho de conclusão de curso (Grau de Engenheiro Civil) - Curso de Engenharia Civil da Escola Politécnica, Universidade Federal do Rio de Janeiro. Rio de Janeiro.
Tinoco, J. E. L. (2009), Mapa de danos: recomendações básicas. Texto para discussão, série 2: Gestão de Restauro, v. 43
Wasaki Engenharia (2023), Benefícios da utilização dos VANTs na construção civil. Disponível em: https://www.wasaki.com.br/beneficios-da-utilizacao-dos-vants-na-construcao-civil/. Acesso em: 20 dez. 2023.