![]()
| Study Case | https://doi.org/10.21041/ra.v15i1.781 |
Defect detection using YOLOv8 for determining the condition of asphalt pavements
Detección de defectos con YOLOv8 para determinar el estado de los pavimentos asfálticos
Detecção de defeitos utilizando YOLOv8 para determinação da condição de pavimentos asfálticos
A. M. Souza1* , C. E. Oliveira1, P. H. B. Decker1, A. L. S. C. Correa1, G. E. R. Amorim1, H. B. Fontenele1
1 Department of Civil Construction, State University of Londrina, Londrina, Brazil.
*Contact author: atilamarconcine@gmail.com
Received: 19/09/2024
Revised: 19/11/2024
Accepted: 10/12/2024
Published: 01/01/2025
| Cite as: Souza, A. M., Oliveira, C. E., Decker, P. H. B., Amorim, G. E. R., Correa, A. L. S. C, Fontenele, H. B. (2025), “Defect detection using YOLOv8 for determining the condition of asphalt pavements.”, Revista ALCONPAT, 15 (1), pp. 79 – 91, DOI: https://doi.org/10.21041/ra.v15i1.781 |
Abstract
This study aimed to evaluate the capacity of the YOLOv8 algorithm to detect potholes, patches, and cracks. To achieve this, a section of a highway was recorded, manually evaluated in the field, and compared with a semi-automatic evaluation based on video processing by the model. The model yielded different results from those obtained through field assessment. Although only a portion of the Maintenance Condition Index is used in the assessment, this marks the first use of an index integrated with YOLOv8. Thus, it is concluded that the model requires further improvements to become viable for definitive application.
Keywords: automation; algorithm; image; computer vision; object detection.
1. INTRODUCTION
In Brazil, road transport is the primary mode of transportation for both passenger and cargo. According to data from the National Road System (Sistema Nacional de Viação - SNV), the country's road network spans approximately 1.7 million kilometers, of which only 213.5 km are paved. Among the paved extension, the CNT Highway Research of 2023 assessed 111,502 km, roughly 52% of the total, using a range of indicators that covers pavement conditions, signage presence, and road geometry. The study concluded that only about 32.5% of the roads were in excellent or good condition, while 26.1% were classified as poor or very poor (CNT, 2023).
Similarly, in the context of assessing the condition of Brazilian highways, particularly federal roads, the National Department of Transport Infrastructure (Departamento Nacional de Infraestrutura de Transportes - DNIT) provides monthly data on the so-called Maintenance Condition Index (Índice de Condição da Manutenção - ICM), which enables the classification of road conditions. This method is discussed and applied further in this study. According to March 2024 report, of the approximately 65,800 km of paved federal highways, data on the ICM is available for stretches totaling 49,500 km, of which 77.7% were classified as good, 15% as regular, and 7.3% as poor or very poor (DNIT, 2024). This leaves about 25% of the federal paved network without data, while the data gap is even more critical for state paved highways and unpaved roads (CNT, 2023). Therefore, evaluating pavement quality is of great importance and represents a significant gap in the national context. Lin, Chen, and Kuo (2021) note that road surface defects, such as potholes and patches, pose significant risks to road users: they not only cause damage to vehicle suspensions but also greatly influence the occurrence of accidents.
Conducting surveys and verifying pavement conditions is essential for assessing their current state and predicting future performance trends. This task represents a significant challenge in Brazil due to the extensive road network. According to Gong et al. (2023), such evaluations are crucial for determining intervention priorities and supporting the selection of maintenance and rehabilitation methods, which are fundamental to Pavement Management Systems.
Given that visual inspection of pavement defects is a complex and inefficient process that requires a substantial workforce, Chunlong et al. (2024) point out that the use of new imaging technologies, combined with computational techniques related to artificial intelligence—mostly deep learning—can provide technical support for collecting and recognizing images of pavement defects.
Related to this topic, one standout algorithm in literature is "You Only Look Once" (YOLO), an object detection tool in images based on deep learning (Du and Jiao, 2022). According to Lu et al. (2015) and Zhao et al. (2019), this model analyzes data from different samples through a convolutional neural network structure, making it efficient for detecting complex objects, such as road defects.
In this context, this research aimed to evaluate the capability of identifying different types of defects (potholes, patches, and cracks) through the filming of a highway section showing clear signs of deterioration. For this purpose, the YOLOv8 object detection algorithm was used in the Google Colab execution environment. Furthermore, to test the model, the ICM was calculated both manually (using field data) and semi-automatically (using information obtained from video processing by the model).
2. LITERATURE REVIEW
Given the importance of pavements as transportation infrastructure and the wide range of defects to which their structures are susceptible, the use of computational technologies as tools to assist in pavement management emerges as a promising alternative, primarily aimed at providing agility in field analyses (Pan & Zhang, 2021). According to El Hakea & Fakhhr (2023), these tools offer potential benefits, such as classification, detection (mapping), segmentation, and quantification of defects, while also enabling the assessment of pavement wear conditions.
Although traditional pavement defect detection through computer vision began as a complex, labor-intensive process with low efficiency, Huang et al. (2023) mention that advancements in image detection technologies and deep learning computational devices have provided significant technical support for image collection and defect recognition in pavements.
Object detection has proven to be a critical component across various fields over the years. Numerous algorithms have been developed to perform this computer vision task, among which YOLO stands out due to its speed and accuracy in identifying objects in images (Terven et al., 2023). The first version of this algorithm was introduced in 2015, and since then, several other versions have been developed, building upon its architecture. Hussain (2023) and Terven et al. (2023) note that in 2023, the company Ultralytics (which also launched YOLOv5) introduced YOLOv8, featuring several innovations compared to its predecessors.
Figure 1 illustrates the architecture of YOLOv8, which is divided into three components: BackBone, Neck, and Head. The BackBone consists of multiple convolutional layers responsible for extracting the features from the input image. These features are then combined in the Neck, where three feature maps are generated for large, medium, and small objects, respectively. Finally, in the Head, detections are performed separately and subsequently combined to produce the output image, which includes the object’s location and confidence score using a bounding box (Ju & Cai, 2023; Terven et al., 2023).
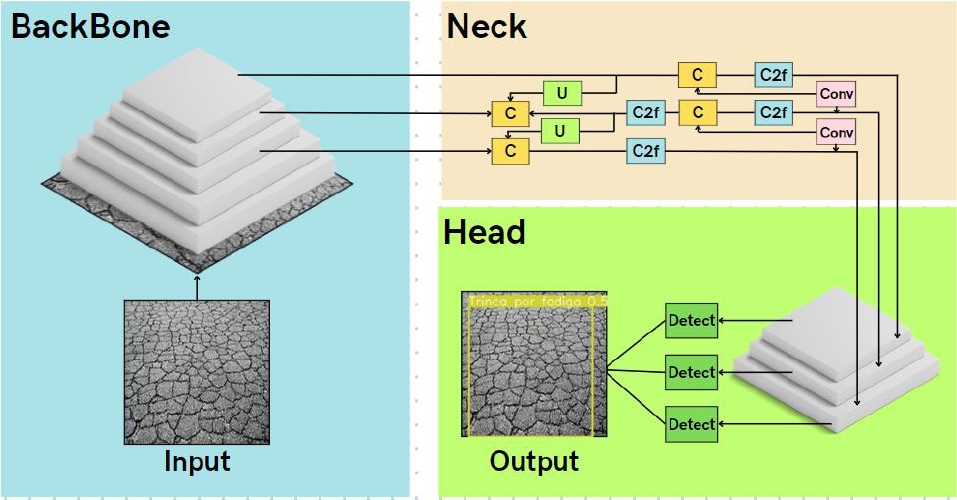
Figure 1. YOLOv8 Architecture
Due to the importance and potential of YOLO, as well as the continuous evolution of its algorithm, several studies have been conducted to expand the range of detectable defects and improve the efficiency of the technology (Du & Jiao, 2022). Among these works, notable examples include: Lin et al. (2021), who used YOLOv3 to detect general pavement defects in Taiwan; Ma et al. (2022) and Gong et al. (2023), who employed automated detection methods to identify cracks using adapted versions of YOLOv3 and YOLOv2, respectively; Huang et al. (2023), who developed a compact model for defect detection based on YOLOv7; Gonçalves et al. (2023), who conducted a literature review and presented the state of the art regarding the use of computer vision for pavement defect detection, reviewing various algorithms applied by other researchers; Chunlong et al. (2024), who implemented an enhanced YOLOv7 framework for detecting various types of cracks; and Yao et al. (2024), who proposed an optimization system based on YOLOv7 for the automatic detection of cracks and potholes in pavements.
Subsequently, Table 1 presents information regarding the YOLO model version used (or revised), the type of pavement studied, and the defects considered in each study.
Table 1. YOLO version, pavement type, and defects analyzed
| Author | Year | YOLO model | Pavement type | Defects analyzed |
| Chunlong Z. et al. | 2024 | YOLOv7 | Asphalt | Transverse Cracks, Longitudinal Cracks, and Fatigue Cracks |
| Yao H. et al. | 2024 | YOLOv7 e YOLOv5 | Asphalt and Concrete | Transverse Cracks, Longitudinal Cracks, Fatigue Cracks, and Potholes |
| Gonçalves M. et al. | 2023 | Various | Various | Various |
| Huang P. et al. | 2023 | YOLOv7 | Asphalt | Potholes, Patches, Cracks |
| Gong H. et al. | 2023 | YOLOv2 | Not Specified | Transverse Cracks, Longitudinal Cracks, Fatigue Cracks, and Potholes |
| Du F.; Jiao S. | 2022 | YOLOv5s | Asphalt | Transverse Cracks, Longitudinal Cracks, Fatigue Cracks, and Potholes |
| Ma D. et al. | 2022 | YOLO-MF (baseado no YOLOv3) | Concrete | General Cracks |
| Lin Y. et al. | 2021 | YOLOv3 | Not Specified | Cracks, Potholes, and Patches |
In general, each study highlights specific areas for potential improvement in computer vision systems, particularly in the context of defect detection. For instance, Chulong et al. (2024) introduced new frame clustering algorithms and a novel grouping module. Yao et al. (2024) compared models based on YOLOv7 with an optimized model derived from YOLOv5. While the optimized model demonstrated superior performance, it required six times more parameters and had a processing speed three times slower.
Nonetheless, Ma et al. (2022), Yao et al. (2024), and Chunlong et al. (2024) identified gaps in defect detection methods for pavements, particularly under complex background and lighting conditions or adverse weather scenarios. Huang et al. (2023) and Du & Jiao (2022) proposed compact algorithms aimed at improving or maintaining accuracy in defect extraction while reducing computational demands for their application.
Through a review of various studies, Gonçalves et al. (2023) evaluated the effectiveness of online image datasets for deep learning training. They identified works that used as few as 200 images as a data source and others that utilized more than 18,000. The authors underscored the need to improve the quality of available datasets, highlighting a clear trend toward better results with an increased number of reference images for model training. These conclusions align with the findings of Huang et al. (2023) and Gong et al. (2023).
In this regard, Du & Jiao (2022) expressed concerns about the reliability of open datasets due to inconsistencies in factors such as camera angles, light intensity, and clarity. They preferred to develop their own data. Additionally, the authors proposed enhancing existing datasets, including through platforms such as Baidu Street View, which is analogous to the more widely used Google Street View in Brazil.
3. MATERIALS AND METHODS
In this study, the methodology was divided into four stages, as illustrated in Figure 2, which are, in order: database creation, YOLOv8 model training, video recording of a roadway using a GoPro Hero 10 Black to test the model, and calculation of the Pavement Index (PI), which is an integral part of determining the Maintenance Condition Index (ICM).
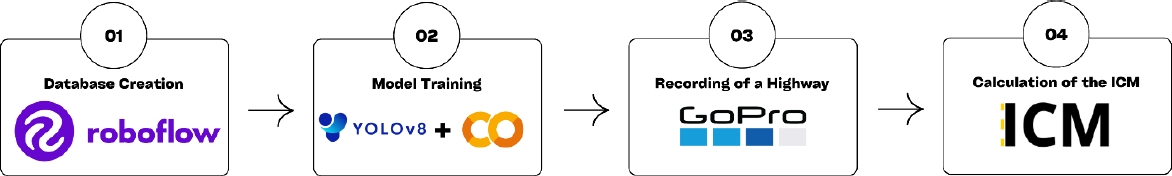
Figure 2. Methodology steps
To create the database, the RoboFlow Universe website was utilized. Through this platform, public image datasets were downloaded free of charge. Among the available images, various types of pavement surface defects were identified, five of which were selected as the focus of this study: potholes, patches, fatigue cracks, longitudinal cracks, and transverse cracks.
The constructed image dataset comprised 7,306 images containing a total of 12,172 defects, as multiple defects could be present in a single image. Table 2 provides details on the quantity of each defect type and the division between images used for training and validation. The dataset can be accessed via the following link: https://universe.roboflow.com/teste-df3tz/defeitos-em-pavimentos.
| Defect Type | Overall | Training | Validation |
| Pothole | 2.604 | 2.090 | 514 |
| Patch | 2.256 | 1.799 | 457 |
| Longitudinal crack | 2.599 | 2.081 | 518 |
| Transverse crack | 2.318 | 1.853 | 465 |
| Fatigue crack | 2.395 | 1.910 | 485 |
| Total | 12.172 | 9.733 | 2.439 |
After constructing the database, the model was trained. The architecture used was YOLOv8x, with the default configurations, except for the number of epochs, which was set to 200. The training phase was conducted using Google Colaboratory, a cloud-based execution environment that provides high-capacity Graphics Processing Units (GPUs). The GPU used was the NVIDIA A100-SXM4-40GB.
After the training, to measure the model's performance, evaluation metrics were obtained. In this study, the metrics used include Precision, Recall, Average Precision (AP), and mean Average Precision (mAP). These metrics are calculated using specific parameters, namely True Positive (TP), False Positive (FP), and False Negative (FN). TP occurs when an image contains the object of interest, and the model correctly predicts its location. FP occurs when the image does not contain the object of interest, but the model incorrectly identifies it as present. FN happens when the image contains the object of interest, but the model fails to identify its location. Using these parameters, Equation 1 calculates the proportion of correctly detected objects, a metric known as Precision, or Positive Predictive Value.
| (1) |
Where: TP = True Positive; FP = False Positive.
The calculation of Recall (as known as Sensitivity) is performed using Equation 2. This metric measures, among the detected objects, how many were correctly identified.
| (2) |
Where: TP = True Positive; FN = False Negative.
Using these metrics, it is possible to generate the Precision-Recall curve, and the area under this curve is used to calculate the AP, as shown in Equation 3. This metric is used to evaluate the model's performance for a single class.
| (3) |
Where: P = Precision; r = Recall.
Finally, mAP represents the arithmetic mean of the AP across all classes and is calculated using Equation 4. This metric is used to evaluate the model's performance across all classes.
| (4) |
Where: mAP= mean Average Precision; N= Number of Classes; AP= Average Precision.
At the end of the training, YOLOv8 returns two mAP values: mAP@50, that represents the model's performance at a confidence threshold of 50%, and mAP@50-95, which measures the model's performance across various thresholds (ranging from 50% to 95%).
To test the trained model, it was selected a section of a single-lane highway, BR-487, in the city of Porto Camargo, Brasil. For this purpose, a video recording was conducted using a GoPro Hero 10 Black camera mounted on the top of a car (Figure 3) at an angle that captured only the pavement.
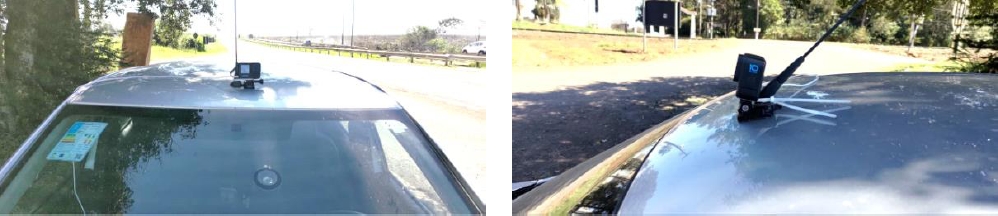
Figure 3. Camera Positioning on the Vehicle
To evaluate the model's performance, the Maintenance Condition Index (ICM) was calculated in two ways: the first was conducted manually in the field by driving along the highway segments in a passenger vehicle at an average speed of 40 km/h, quantifying each type of defect per kilometer; the second was carried out semi-automatically, using the video recording of the section to quantify the defects identified by the model after processing.
It is noteworthy that the video was processed twice through the model to obtain detections at two confidence thresholds (50% and 70%). The use of thresholds is crucial for assessing the model's performance by observing variations in true positives, false positives, and false negatives, as detections below the indicated percentages are not considered.
According to DNIT (2022), the ICM is used to parameterize the maintenance condition assessment of paved highways under DNIT’s jurisdiction. To calculate the index, an empirical formula (Equation 5) is applied, where the Pavement Index (IP, Equation 6) accounts for 70% of the value and the Conservation Index (IC) represents the remaining 30%.
| (5) |
Where: ICM = Maintenance Condition Index; IP = Pavement Index; IC = Conservation Index.
To determine the IP (Equation 6), the pavement surface is assessed based on the number of potholes, patches, and the percentage of cracked area, according to the frequency of occurrence shown in Table 3.
| (6) |
Where: P(B) = Frequency of potholes (value as per Table 4); P(R) = Frequency of patches (value as per Table 4); P(T) = Frequency of cracks (value as per Table 4).
Table 3. Frequency of Occurrence for Roadway Surface Elements
| Defect | Low | Medium | High | Unit |
| Pothole | Up to 2 | 3 a 5 | Greater than 5 | Quantity / km |
| Patch | Up to 2 | 3 a 5 | Greater than 5 | Quantity / km |
| Cracking | T <10% | 10% < T<50% | T >50% | % Area / km |
Source. Adapted from DNIT (2022).
To calculate the IC, the evaluation considers factors such as vegetation height, presence and condition of drainage systems, and presence of horizontal and vertical signage. For this study, only the pavement segment was analyzed, because the objective was defect recognition. Thus, it was necessary to determine a specific range of values for IP to classify the condition based on this index. Accordingly, in Equation 6, the values for the best and worst possible scenarios were applied, as indicated in Table 4. The resulting values were 25 (low frequency), 50 (medium frequency), and 100 (high frequency). Based on these results, it was proposed the classification range shown in Table 5.
Table 4. Values to be used according to the frequency of occurrence.
| Defect | Low | Medium | High |
| Pothole | 0,25 | 0,50 | 1,00 |
| Patch | 0,25 | 0,50 | 1,00 |
| Cracking | 0,25 | 0,50 | 1,00 |
Source. Adapted from DNIT (2022).
Table 5. Condition Classification Based on IP
| Condition | IP Range |
| Good | IP ≤ 25 |
| Fair | 25< IP< 50 |
| Poor | 50 ≤ IP< 75 |
| Very Poor | IP≥ 75 |
Regarding the cracking defect specifically, it is important to highlight that in the video analysis, all three types of cracks (longitudinal, transverse, and fatigue) detected by the model were considered. The percentage of cracked area was calculated based on the video frames, which were extracted using VLC Media Player software. The cracking percentage was then calculated using Equation 7.
| (7) |
4. RESULTS AND DISCUSSIONS
After training the model, it was possible to obtain the evaluation metrics: Precision, Recall, mAP@50, and mAP@50-95. The values obtained for those were 65.4%, 60.2%, 59.5%, and 33.7%, respectively. Despite the training being conducted for 200 epochs, the best results, as described above, were achieved in epoch 136.
Figure 4 shows the Precision-Recall curve generated by the model. It is evident that YOLOv8x achieved the best result for the patch defect, with an AP of 85.9%. The detection of potholes and fatigue cracks also performed above average. However, for longitudinal and transverse cracks, the AP values obtained were less impressive.
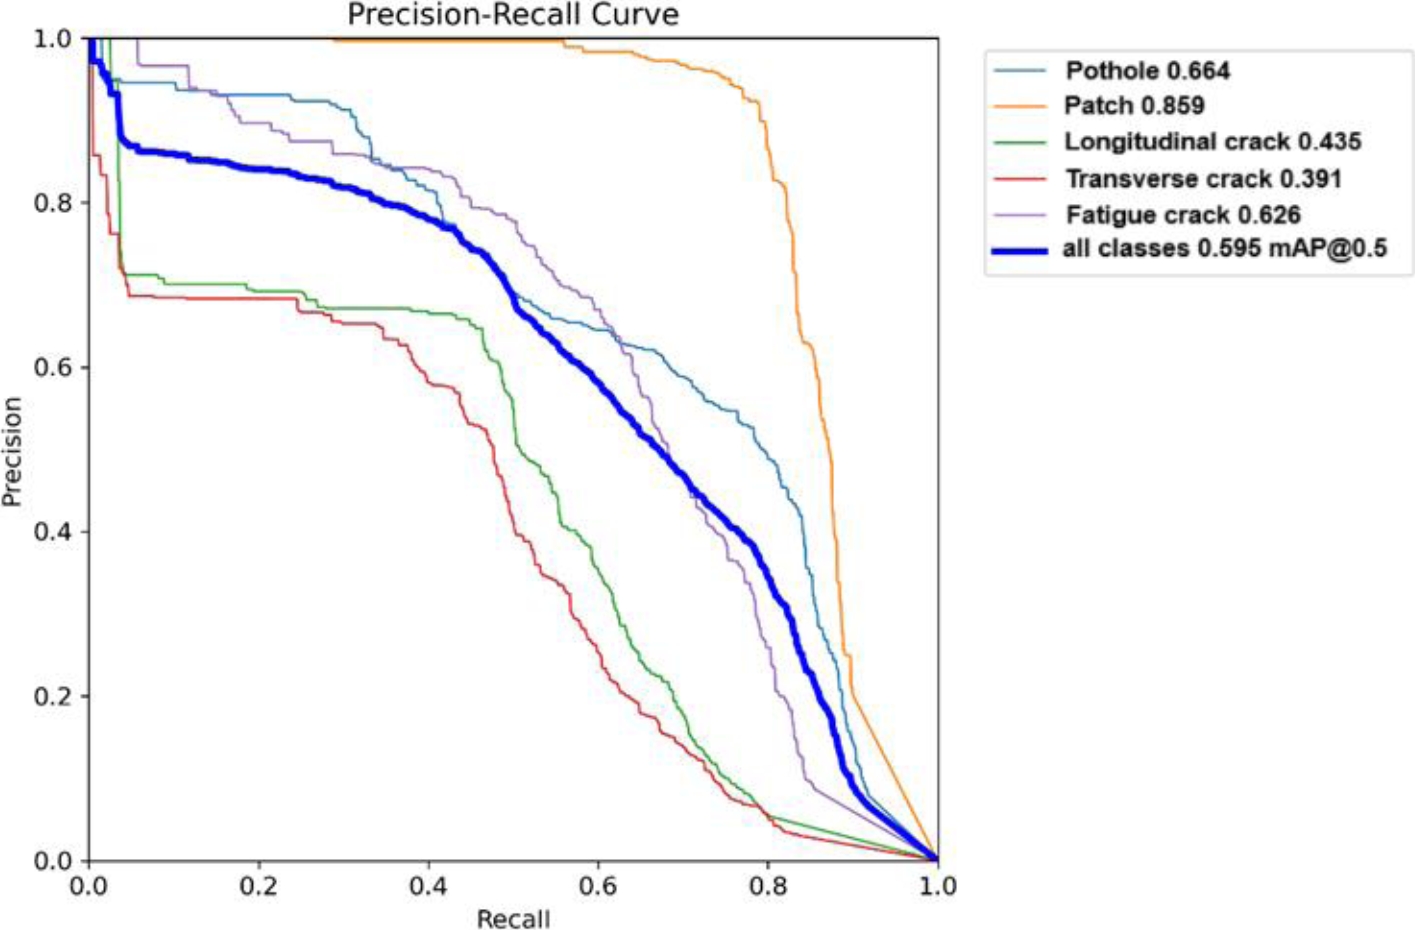
Figure 4. Precison-Recall Curve
Based on the field evaluation and the two videos (with 50% and 70% confidence thresholds), the quantity (record) and class (frequency of occurrence) of each defect studied were obtained. Table 6 refers to the pothole defect, and shows that, at the 50% threshold, the model produced results similar to the field analysis, except for the last part of the section (from km 2 to km 1). At the 70% threshold, the results were unsatisfactory, as only two out of the ten potholes present in the entire analyzed section were detected.
Table 6. Evaluation of the Pothole Defect.
| km | Field | Threshold 50% | Threshold 70% | |||
| Record | Class | Record | Class | Record | Class | |
| 4-3 | 4 | Medium | 4 | Medium | 1 | Low |
| 3-2 | 2 | Low | 1 | Low | 0 | Low |
| 2-1 | 4 | Medium | 2 | Low | 1 | Low |
Table 7 shows the evaluation of the patch defect and illustrates that even with the highest mAP achieved during the training phase, none of the model's evaluations, at either of the thresholds, coincided with the field assessment.
Table 7. Evaluation of the Patch Defect
| km | Field | Threshold 50% | Threshold 70% | |||
| Record | Class | Record | Class | Record | Class | |
| 4-3 | 3 | Medium | 6 | High | 0 | Low |
| 3-2 | 4 | Medium | 24 | High | 11 | High |
| 2-1 | 6 | High | 0 | Low | 0 | Low |
In addition to the absence of detections from km 2 to km 1, Table 7 indicates that additional detections were made at the 50% threshold in the other subdivisions. This occurred due to the presence of false positives, with the most significant being the detection of a patch off the road. Increasing the threshold to 70% reduced some of these erroneous detections from km 3 to km 2. However, 11 false positives still remained. For example, Figure 5 illustrates a false positive with 72% confidence.
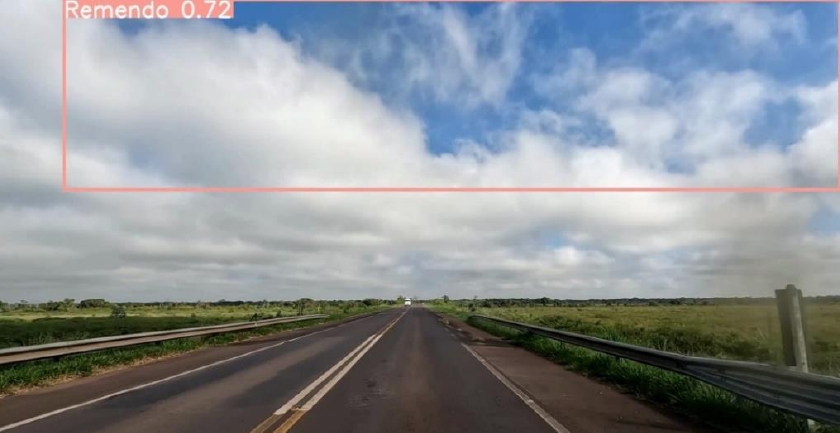
Figure 5. False Positive Patch
For the evaluation of cracking, Table 8 was created. It demonstrates that, although the recorded percentage differs from that obtained in the field, both frequencies at the 50% threshold coincided with the field data. The same almost occurred at the 70% threshold; however, the class of this defect was considered low by the model from km 3 to km 2.
Table 8. Evaluation of Cracking
| km | Field | Threshold 50% | Threshold 70% | |||
| Record | Class | Record | Record | Class | Record | |
| 4-3 | 45,00% | Medium | 29,54% | Medium | 11,56% | Medium |
| 3-2 | 35,00% | Medium | 29,01% | Medium | 7,36% | Low |
| 2-1 | 40,00% | Medium | 48,73% | Medium | 19,25% | Medium |
Finally, the IP was calculated to assess the condition of the section under study, and the result is presented in Table 9.
Table 9. Condition of the Section According to the IP
| km | Field | Threshold 50% | Threshold 70% | |||
| Record | Class | Record | Condição | Record | Class | |
| 4-3 | 50,00 | Poor | 65,00 | Poor | 22,50 | Good |
| 3-2 | 37,50 | Fair | 52,50 | Poor | 35,00 | Fair |
| 2-1 | 65,00 | Poor | 22,50 | Good | 22,50 | Good |
In this way, the field analysis shows that the pavement in question is in poor condition in the first and last kilometers, while from km 3 to km 2, the condition is fair. In the video analysis with a 50% threshold, it is noted that only the km 4 to km 3 section was evaluated similarly by the model, while the other sections differed from the field evaluation. In the video with a 70% threshold, although one of the results coincided with the field evaluation, it was precisely the section where the false positive patches occurred.
5. CONCLUSION
Based on the results presented, it is concluded that, despite the satisfactory training results of the YOLOv8 architecture, when applied in practice alongside an index, the model's performance was below expectations. The best results were observed in the evaluation of potholes and cracks at the 50% threshold.
The unsatisfactory performance and the high occurrence of false positives (particularly in patch detection) can be attributed to the size of the image database, which is expected to be expanded in future researches, as recommended by Gonçalves et al. (2023), Huang et al. (2023), and Gong et al. (2023). Additionally, using proprietary images, as suggested by Du & Jiao (2022), will help improve the model's accuracy.
Furthermore, future research should focus on evaluating the performance of compact models mentioned by Huang et al. (2023) and Du and Jiao (2022), as well as exploring newer versions of the YOLO architecture, such as YOLOv9 and YOLOv10, developed by Wang C. et al. (2024) and Wang A. et al. (2024), for defect detection in pavements.
6. ACKNOWLEDGMENTS
The authors of this article would like to express their gratitude to the National Department of Transport Infrastructure (DNIT), especially Engineer Elcio Guerino Filho and the entire technical team from the Local Unit of Campo Mourão, for allowing the use of the video footage from the BR-487 highway section. We would also like to thank the Coordination for the Improvement of Higher Education Personnel (CAPES) for the scholarship provided.
7. REFERENCES
Chunlong, Z., Peile, H., Shenghuai, W., Chen, W., Hongxia, W. (2024). Pavement Defect Detection Algorithm Based on Improved YOLOv7 Complex Background. IEEE Access, 12, 32870–32880. https://doi.org/10.1109/ACCESS.2024.3370604
Confederação Nacional dos Transportes (CNT). (2023). Pesquisa CNT de Rodovias 2023. Disponível em: https://agenciadenoticias.ms.gov.br/wp-content/uploads/2024/01/pesquisa_cnt_rodovias_2024_relatorio_gerencial.pdf. Accessed on: May 6, 2024.
Departamento Nacional de Infraestrutura de Transportes. (2024). Condições do Pavimento em março/2024. Disponível em: https://servicos.dnit.gov.br/dadosabertos/dataset/condicoes-do-pavimento/resource/030e374d-a505-4d16-a283-610a29008746. Accessed on: May 6, 2024.
Departamento Nacional de Infraestrutura de Transportes. (2024). Resolução nº 5/2022, de 27 de abril de 2022. Disponível em: https://www.gov.br/dnit/pt-br/central-de-conteudos/atos-normativos/tipo/resolucoes/resolucao-5-2022-dir-ba-080-de-29-04-2022.pdf. Accessed on: April 8, 2024.
Du, F. J., Jiao, S. J. (2022). Improvement of Lightweight Convolutional Neural Network Model Based on YOLO Algorithm and Its Research in Pavement Defect Detection. Sensors, 22(9). https://doi.org/10.3390/s22093537
Ju, R. Y., Cai, W. (2023). Fracture detection in pediatric wrist trauma X-ray images using YOLOv8 algorithm. Scientific Reports, 13(1). https://doi.org/10.1038/s41598-023-47460-7
El Hakea, A. H., Fakhr, M. W. (2023). Recent computer vision applications for pavement distress and condition assessment. In Automation in Construction (Vol. 146). Elsevier B.V. https://doi.org/10.1016/j.autcon.2022.104664
Gonçalves, M., Marques, T., Gaspar, P. D., Soares, V. N. G. J., Caldeira, J. M. L. P. (2023). Road Pavement Damage Detection using Computer Vision Techniques: Approaches, Challenges and Opportunities. Revista de Informatica Teorica e Aplicada, 30(2), 22–35. https://doi.org/10.22456/2175-2745.129787
Gong, H., Tešić, J., Tao, J., Luo, X., Wang, F. (2023). Automated Pavement Crack Detection with Deep Learning Methods: What Are the Main Factors and How to Improve the Performance? In Transportation Research Record (Vol. 2677, Issue 10, pp. 311–323). SAGE Publications Ltd. https://doi.org/10.1177/03611981231161358
Huang, P., Wang, S., Chen, J., Li, W., Peng, X. (2023). Lightweight Model for Pavement Defect Detection Based on Improved YOLOv7. Sensors, 23(16). https://doi.org/10.3390/s23167112
Hussain, M. (2023). YOLO-v1 to YOLO-v8, the Rise of YOLO and Its Complementary Nature toward Digital Manufacturing and Industrial Defect Detection. In Machines (Vol. 11, Issue 7). Multidisciplinary Digital Publishing Institute (MDPI). https://doi.org/10.3390/machines11070677
Lin, Y. C., Chen, W. H., Kuo, C. H. (2021). Implementation of pavement defect detection system on edge computing platform. Applied Sciences (Switzerland), 11(8). https://doi.org/10.3390/app11083725
Lu, J., Behbood, V., Hao, P., Zuo, H., Xue, S., Zhang, G. (2015). Transfer learning using computational intelligence: A survey. Knowledge-Based Systems, 80, 14–23. https://doi.org/10.1016/j.knosys.2015.01.010
Ma, D., Fang, H., Wang, N., Zhang, C., Dong, J., Hu, H. (2022). Automatic Detection and Counting System for Pavement Cracks Based on PCGAN and YOLO-MF. IEEE Transactions on Intelligent Transportation Systems, 23(11), 22166–22178. https://doi.org/10.1109/TITS.2022.3161960
Pan, Y., Zhang, L. (2021). Roles of artificial intelligence in construction engineering and management: A critical review and future trends. In Automation in Construction (Vol. 122). Elsevier B.V. https://doi.org/10.1016/j.autcon.2020.103517
Terven, J., Córdova-Esparza, D. M., Romero-González, J. A. (2023). A Comprehensive Review of YOLO Architectures in Computer Vision: From YOLOv1 to YOLOv8 and YOLO-NAS. In Machine Learning and Knowledge Extraction (Vol. 5, Issue 4, pp. 1680–1716). Multidisciplinary Digital Publishing Institute (MDPI). https://doi.org/10.3390/make5040083
Wang, A., Chen, H., Liu, L., Chen, K., Lin, Z., Han, J., Ding, G. (2024). YOLOv10: Real-Time End-to-End Object Detection. http://arxiv.org/abs/2405.14458
Wang, C.-Y., Yeh, I.-H., Liao, H.-Y. M. (2024). YOLOv9: Learning What You Want to Learn Using Programmable Gradient Information. http://arxiv.org/abs/2402.13616
Yao, H., Fan, Y., Wei, X., Liu, Y., Cao, D., You, Z. (2024). Research and optimization of YOLO-based method for automatic pavement defect detection. Electronic Research Archive, 32(3), 1708–1730. https://doi.org/10.3934/ERA.2024078
Zhao, Z. Q., Zheng, P., Xu, S. T., Wu, X. (2019). Object Detection with Deep Learning: A Review. In IEEE Transactions on Neural Networks and Learning Systems (Vol. 30, Issue 11, pp. 3212–3232). Institute of Electrical and Electronics Engineers Inc. https://doi.org/10.1109/TNNLS.2018.2876865